Overview
- APM Traces - Distributed tracing via dd-trace-go v2 with W3C Trace Context support for end-to-end request visibility
- LLM Observability - Native Datadog LLM Obs integration for AI/ML-specific monitoring
- Metrics - Operational metrics via DogStatsD or the Metrics API
Deployment Modes
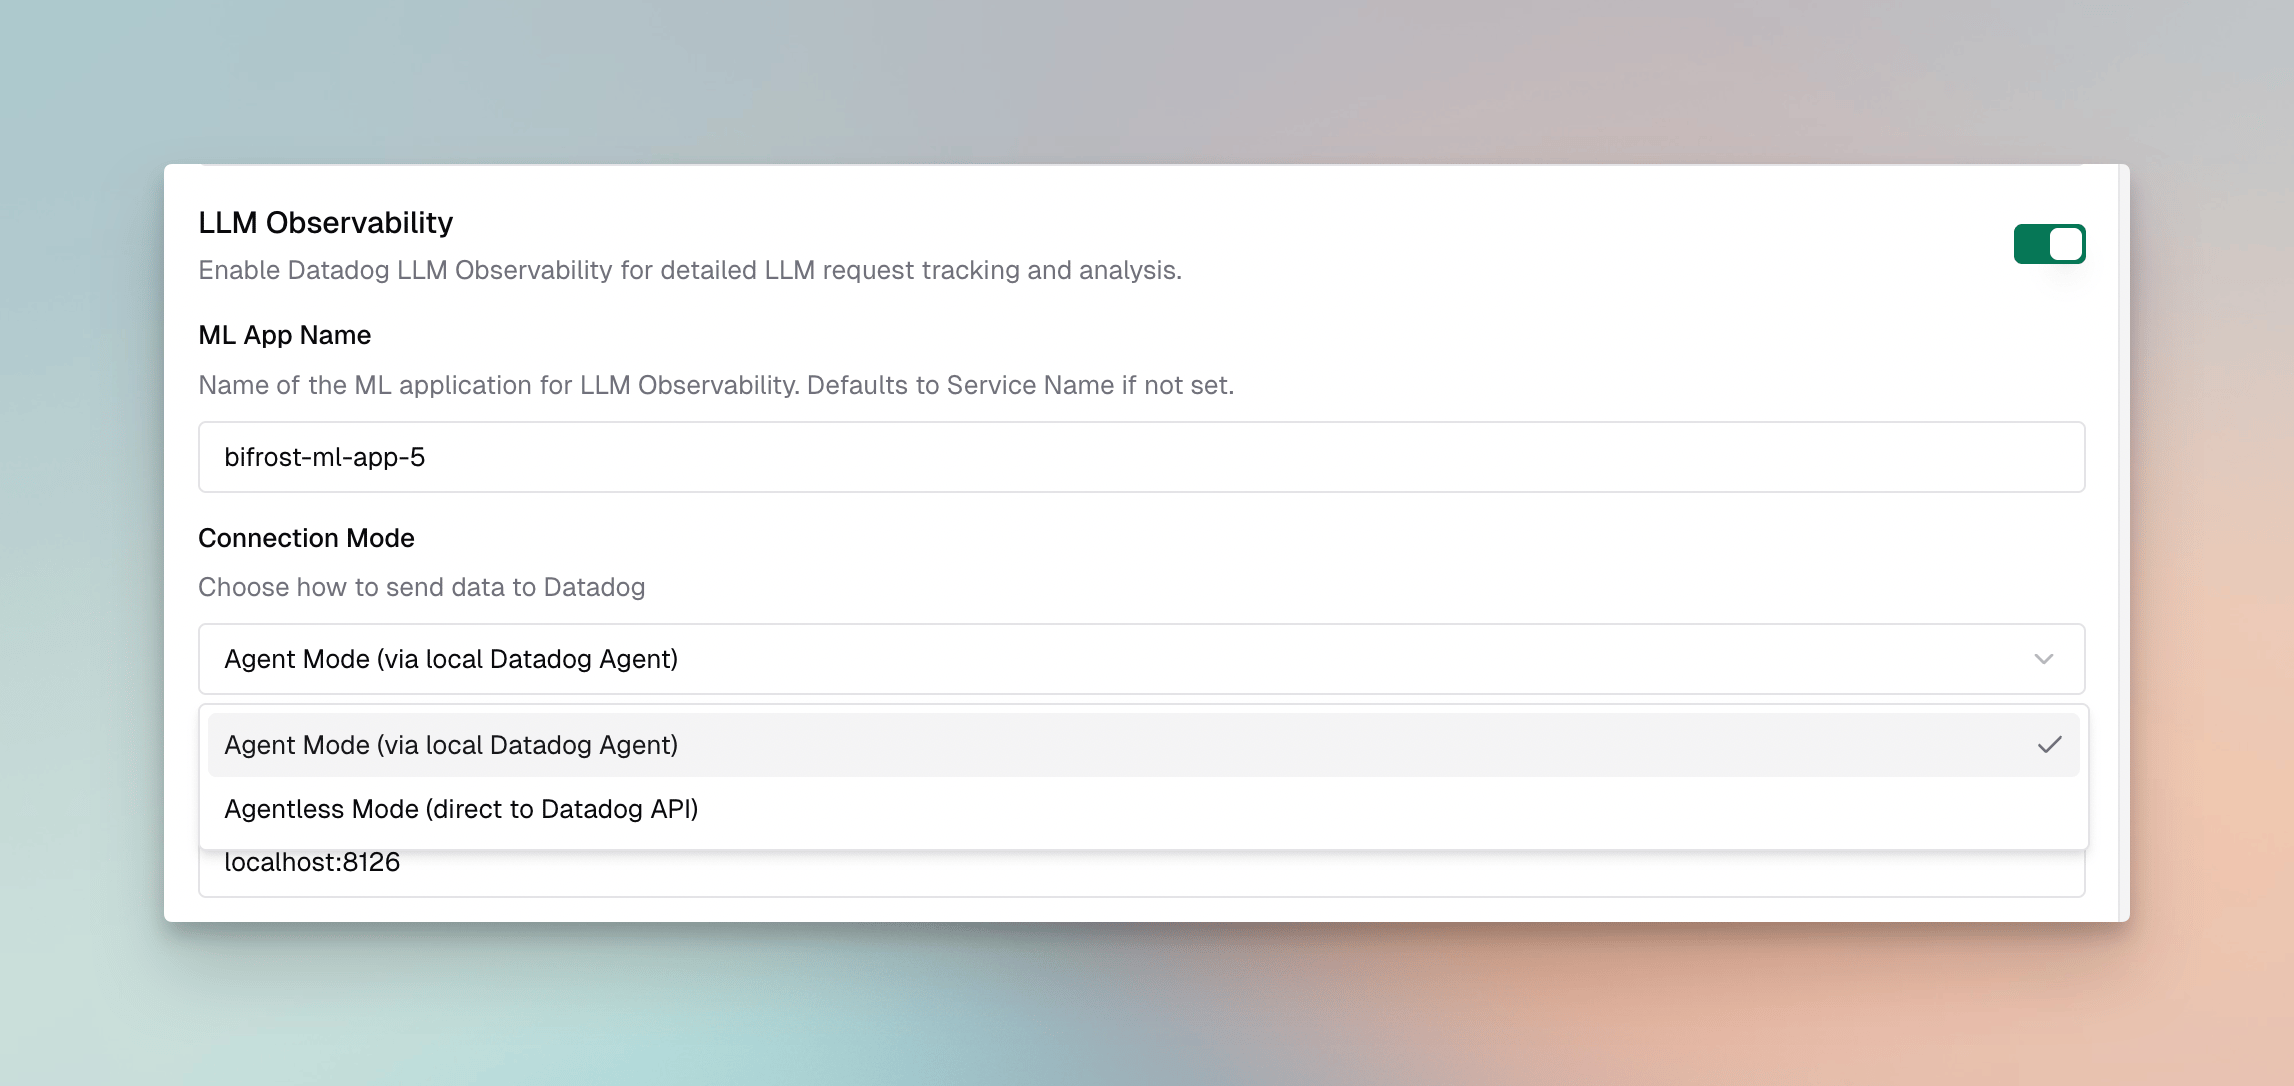
Agent Mode
In agent mode, the plugin communicates with a locally running Datadog Agent:- APM Traces → Agent at
localhost:8126 - Metrics → DogStatsD at
localhost:8125
Agentless Mode
In agentless mode, the plugin sends data directly to Datadog’s intake APIs ({site} is your configured Datadog site, e.g. datadoghq.com):
- LLM Observability →
https://api.{site}/api/intake/llm-obs/v1/trace/spans - Metrics →
https://api.{site}Metrics API (series to/api/v2/series, distributions to/api/v1/distribution_points)
Datadog officially supports agentless submission for LLM Observability and metrics, but not for general APM tracing - the dd-trace-go setup assumes a running Agent (or the serverless extension). The plugin points the tracer at the public trace intake so APM spans are still emitted, but if you need fully-supported APM, run the Datadog Agent (agent mode). LLM Observability and metrics are unaffected.
Configuration
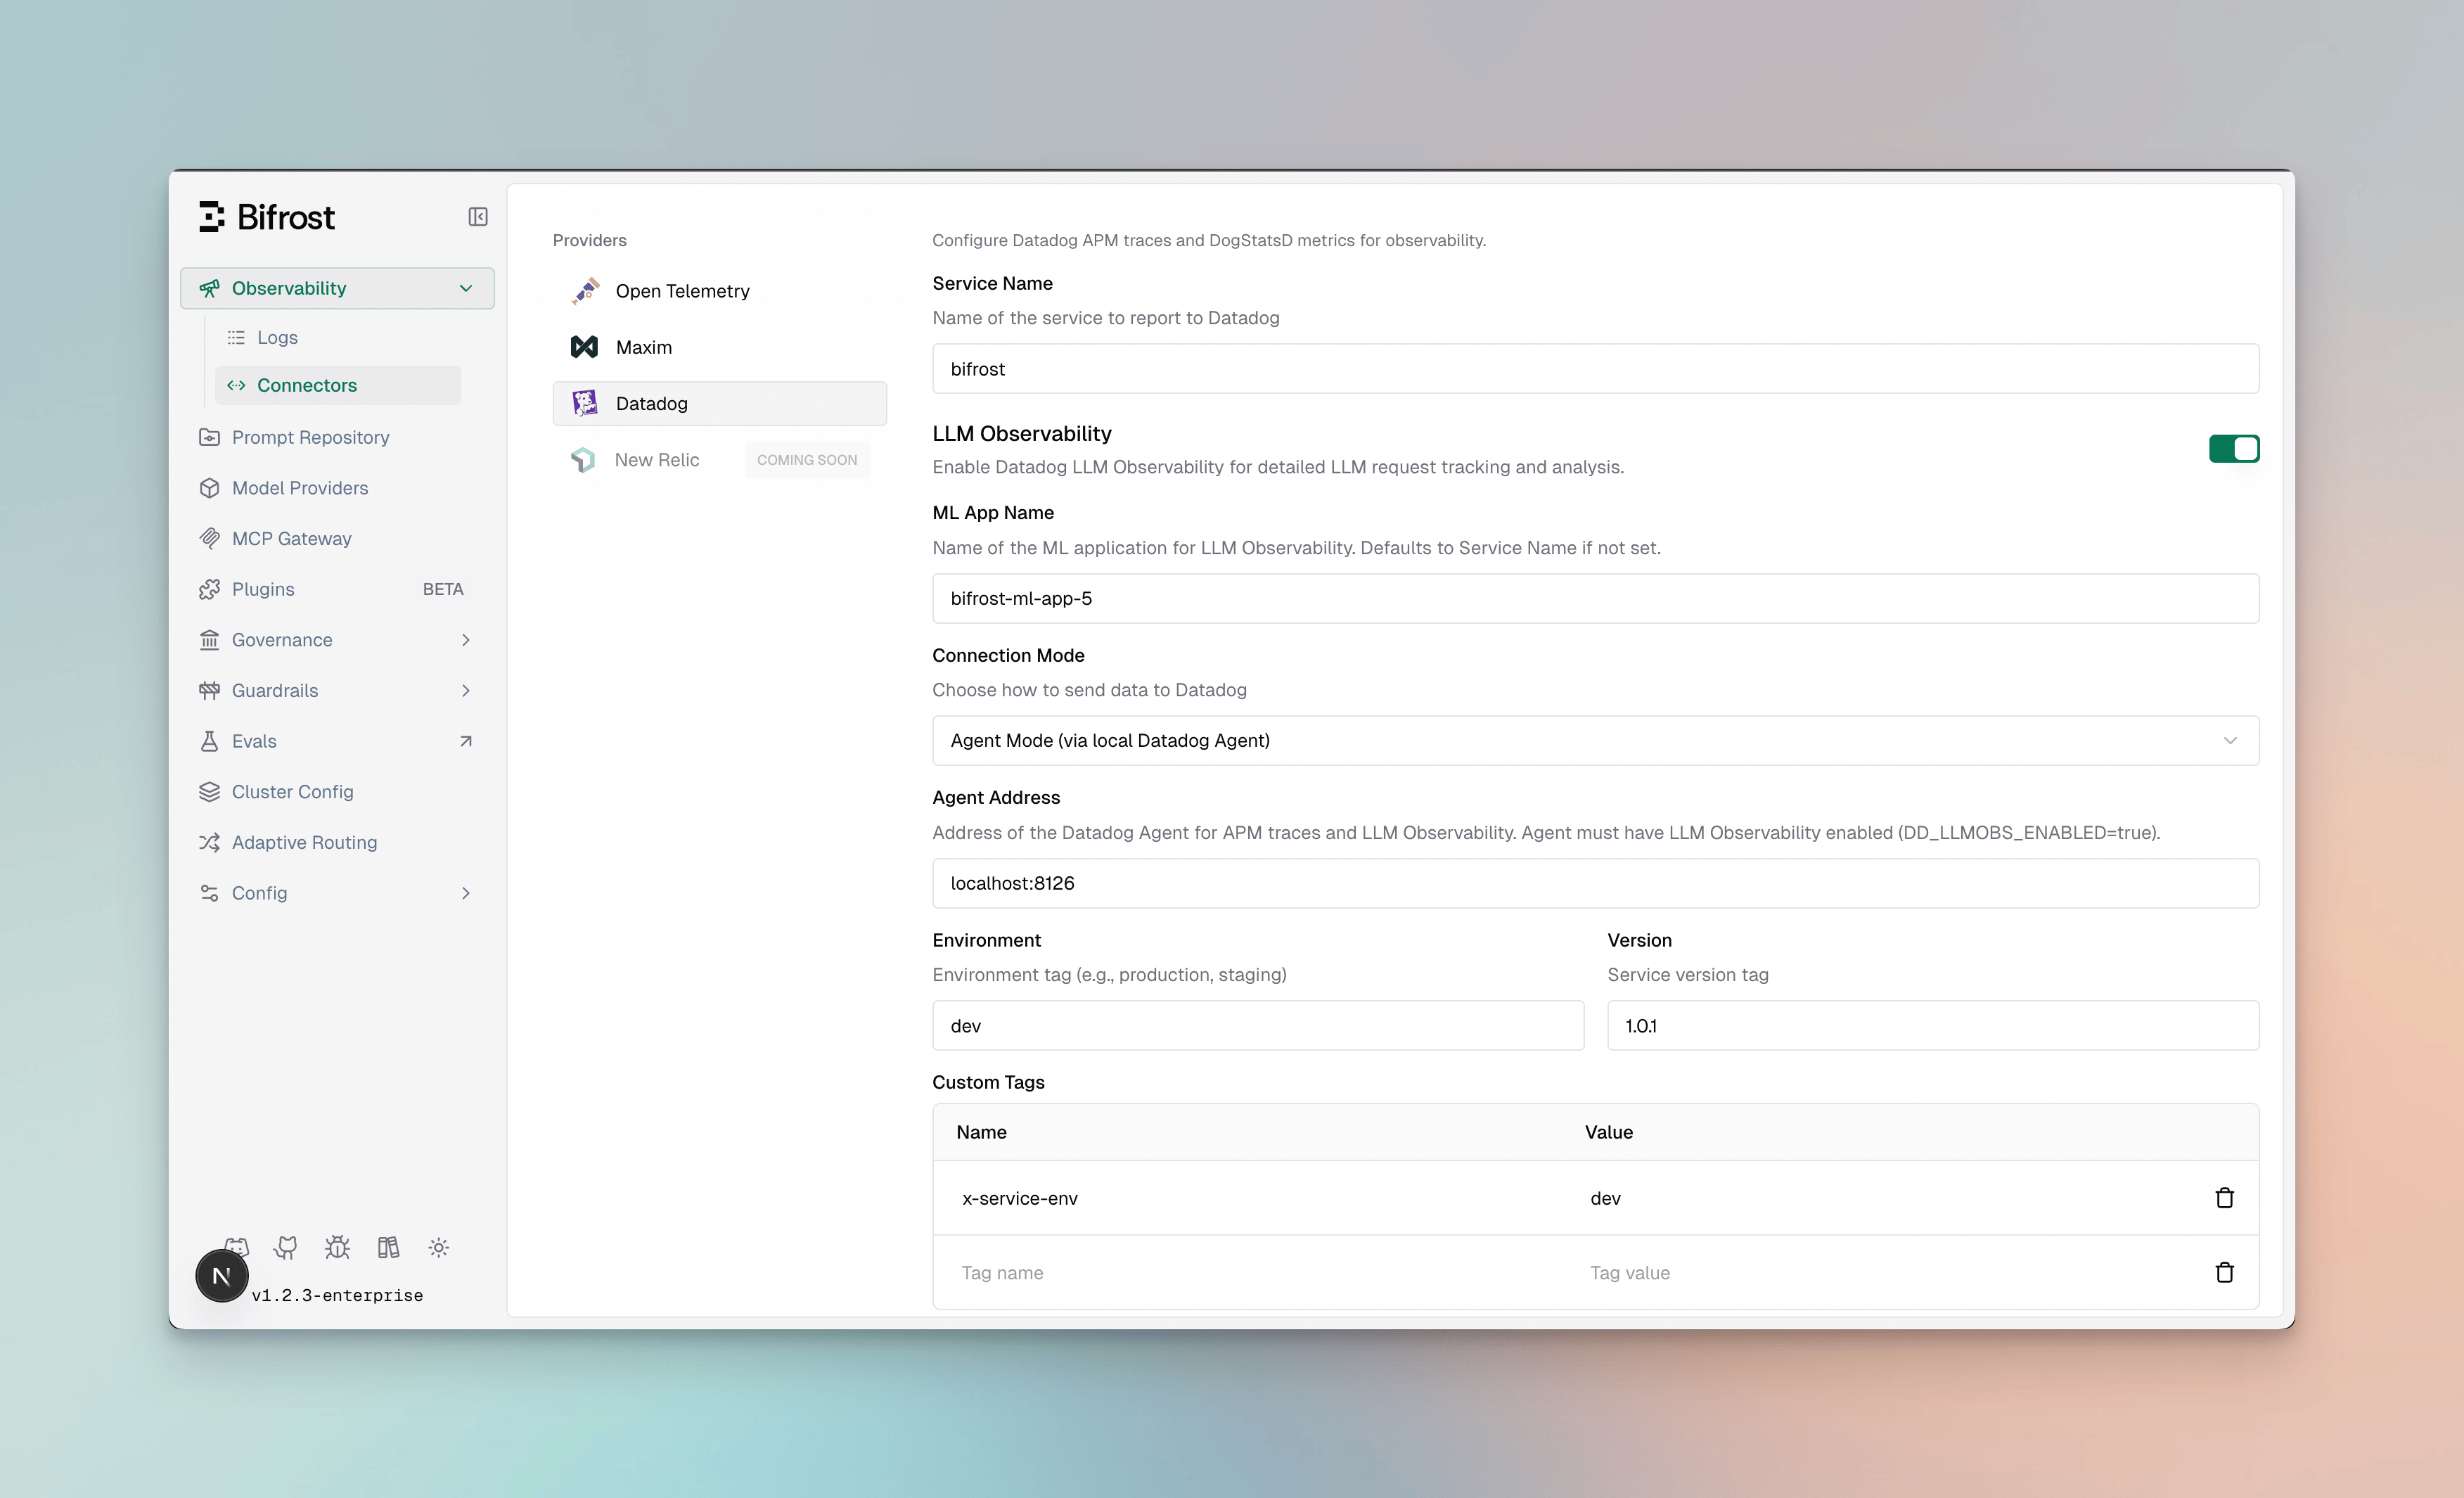
Required Fields
Environment Variable Substitution
Theapi_key, agent_addr, agent_host, agent_port, dogstatsd_addr, dogstatsd_host, dogstatsd_port, and custom_tags fields support environment variable substitution using the env. prefix:
Substitution is whole-value only —
"env.DD_HOST:8125" does not work, because the entire field is treated as one variable reference. If your environment exposes the agent host and port as separate variables (common in Kubernetes, where the host is injected from the downward API status.hostIP and the port is fixed), use the separate agent_host / agent_port and dogstatsd_host / dogstatsd_port fields instead of agent_addr / dogstatsd_addr. When a *_host field is set it takes precedence over the combined *_addr, and the matching *_port defaults to 8126 (agent) / 8125 (DogStatsD).Separate host and port (Kubernetes)
8126 (agent) and 8125 (DogStatsD). Set agent_port / dogstatsd_port (literal or env. reference) only if your agent listens on non-standard ports.
With the Kubernetes downward API injecting the node IP:
Setup
- UI
- Go SDK
- config.json
- Navigate to Plugins
- Enable the Datadog plugin
- Configure the required fields based on your deployment mode
Datadog Sites
The plugin supports all Datadog regional sites. Set thesite field to match your Datadog account region:
Ensure your API key corresponds to the selected site. API keys from one region will not work with another.
LLM Observability
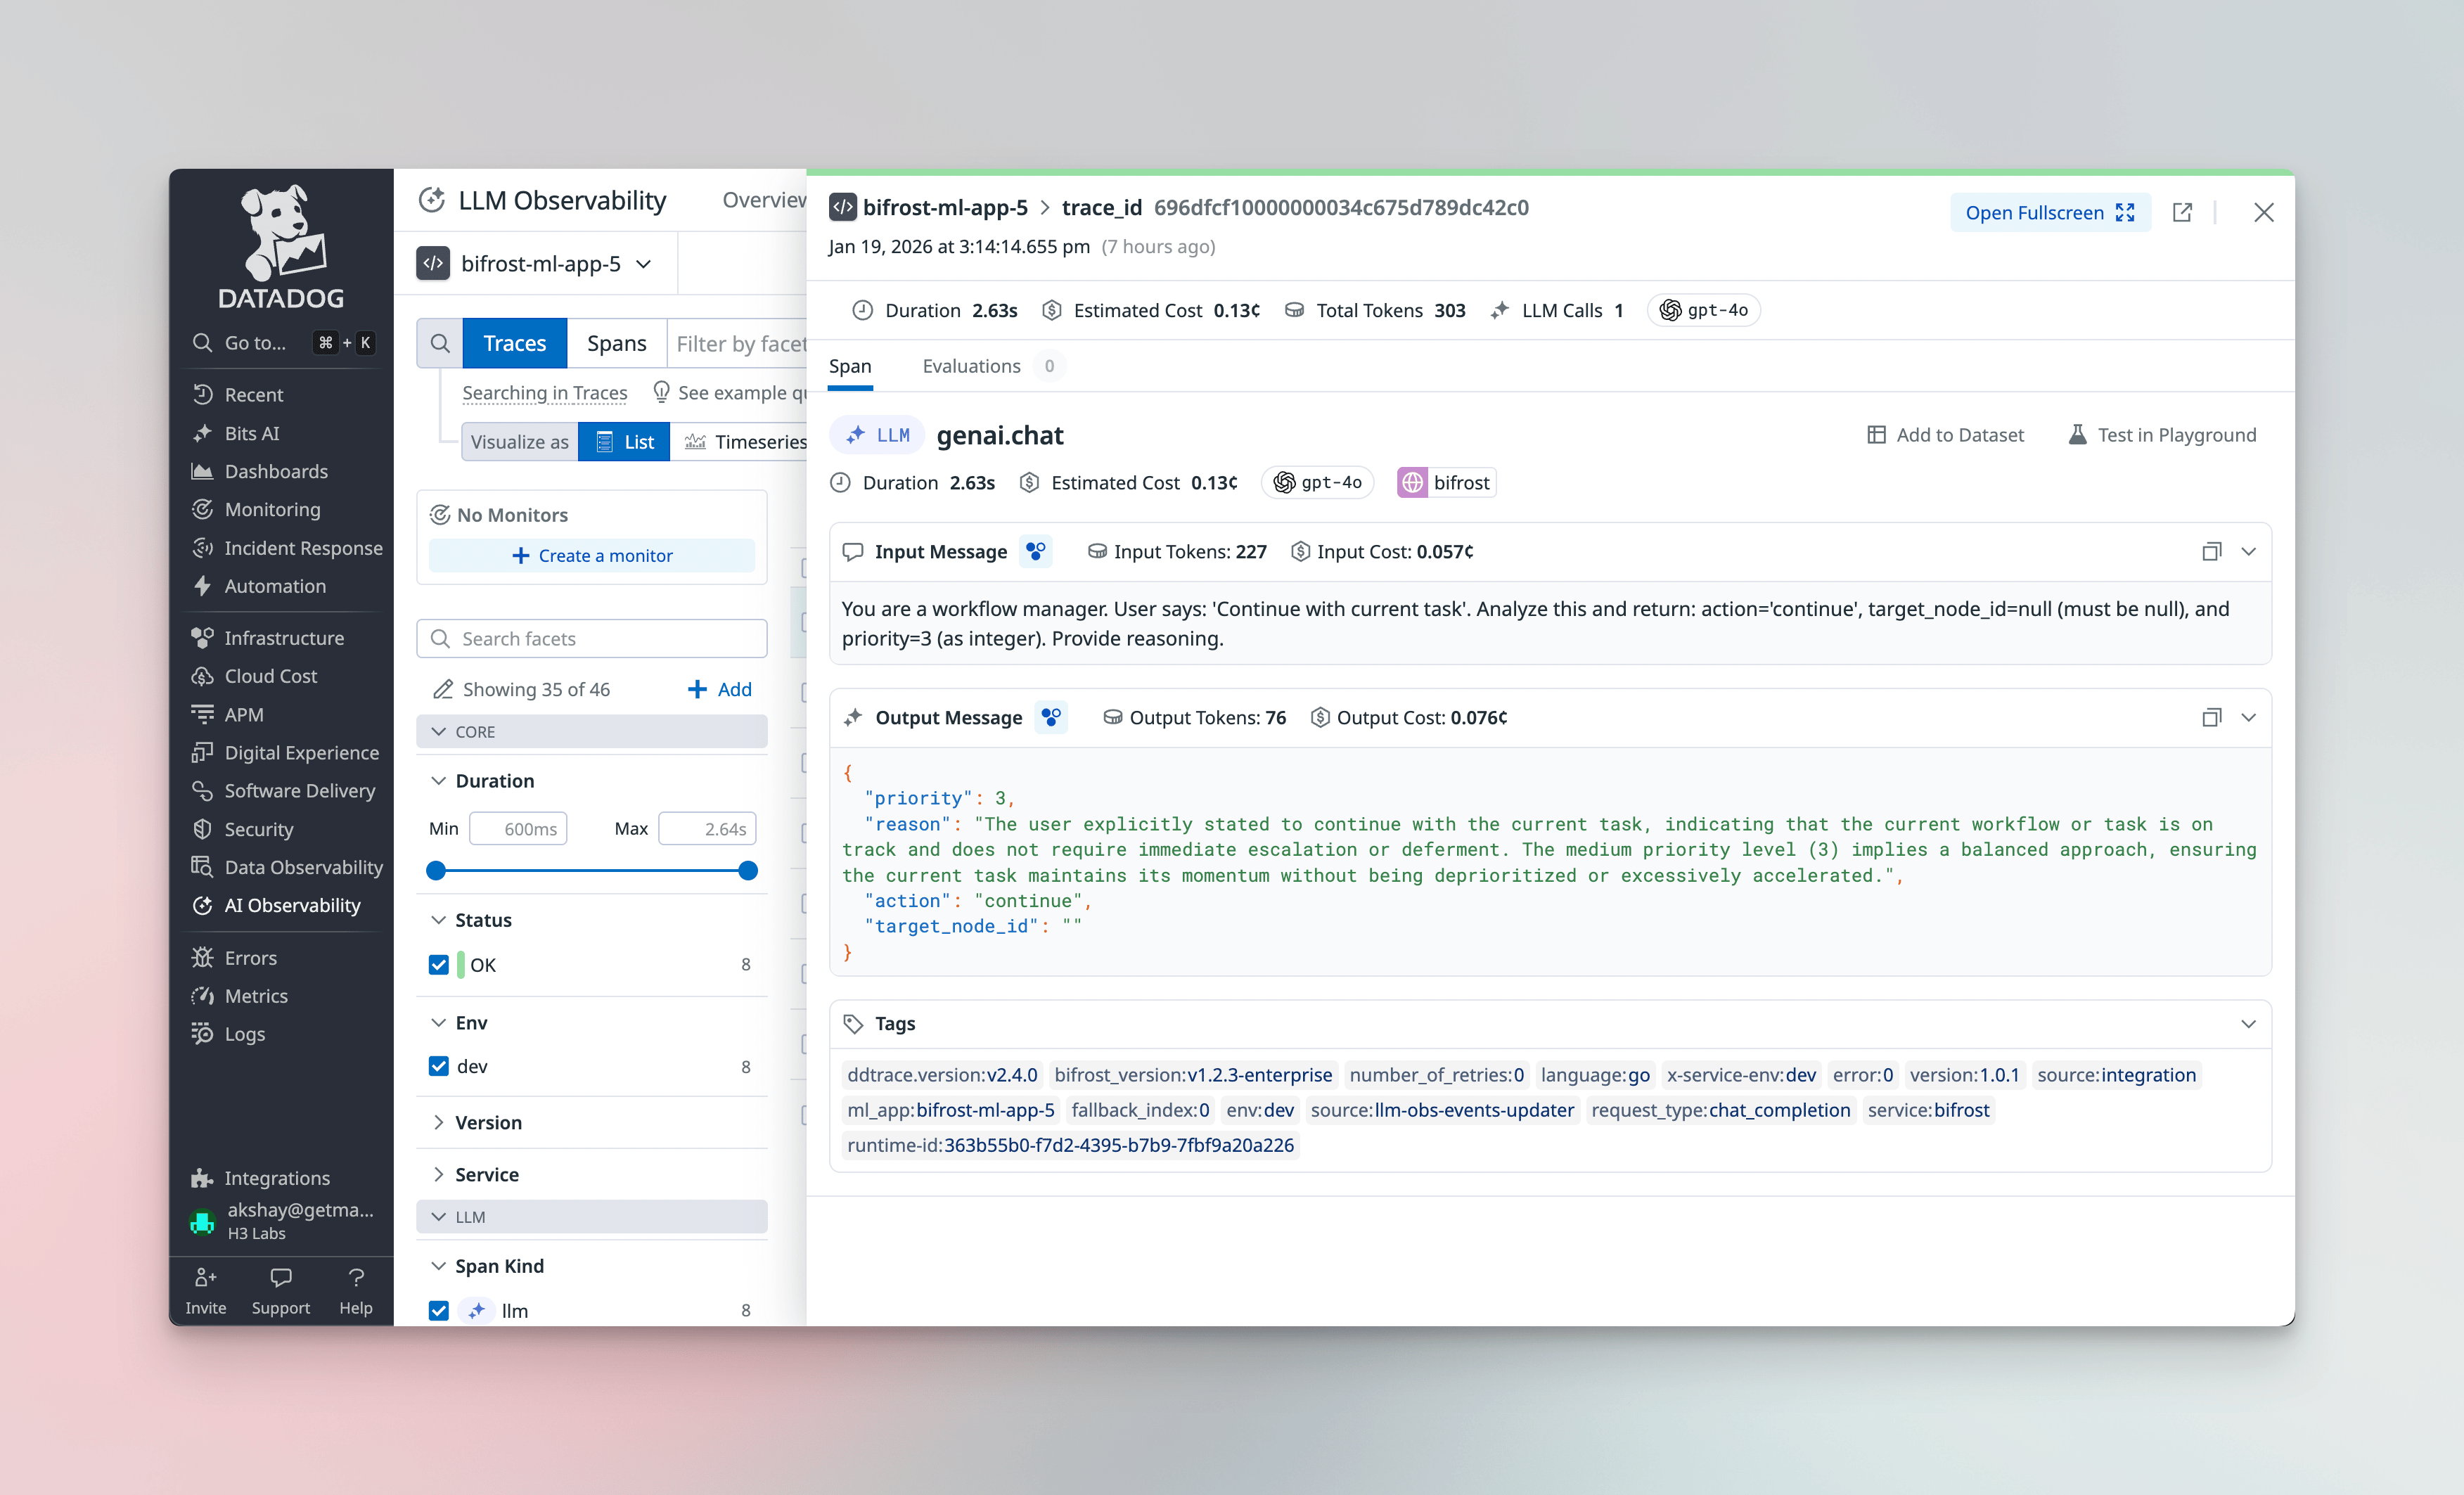
ML App Grouping
LLM traces are grouped under an ML App in Datadog. By default, this uses yourservice_name, but you can specify a dedicated ML App name:
- Group related LLM operations across multiple services
- Track costs and performance by application
- Apply ML-specific alerts and dashboards
Session Tracking
The plugin supports session tracking via thex-bf-session-id header. Include this header in your requests to group related LLM calls into a conversation session:
Grouping APM Traces by Session
By default, every request is its own APM trace, so a multi-turn conversation appears as many separate traces in the APM trace view. (Cross-trace grouping normally lives in LLM Observability sessions, a separate product from APM.) Enablegroup_traces_by_session to instead group every request sharing the same x-bf-session-id into a single APM trace, where each request renders as a top-level sibling span:
x-bf-session-id value, so all requests carrying that header resolve to the same trace.
- Agent mode only. APM spans are emitted only in agent mode. In agentless mode the plugin emits LLM Observability spans only, which already group via session tracking.
- W3C traceparent takes precedence. If a request carries an inbound
traceparentheader, it stays on that distributed trace and is not regrouped by session. - APM traces are not built for long-lived sessions. Datadog has practical limits on spans-per-trace and trace-assembly windows; very long sessions may render with large time gaps or be truncated. For long conversations, prefer LLM Observability sessions.
W3C Distributed Tracing
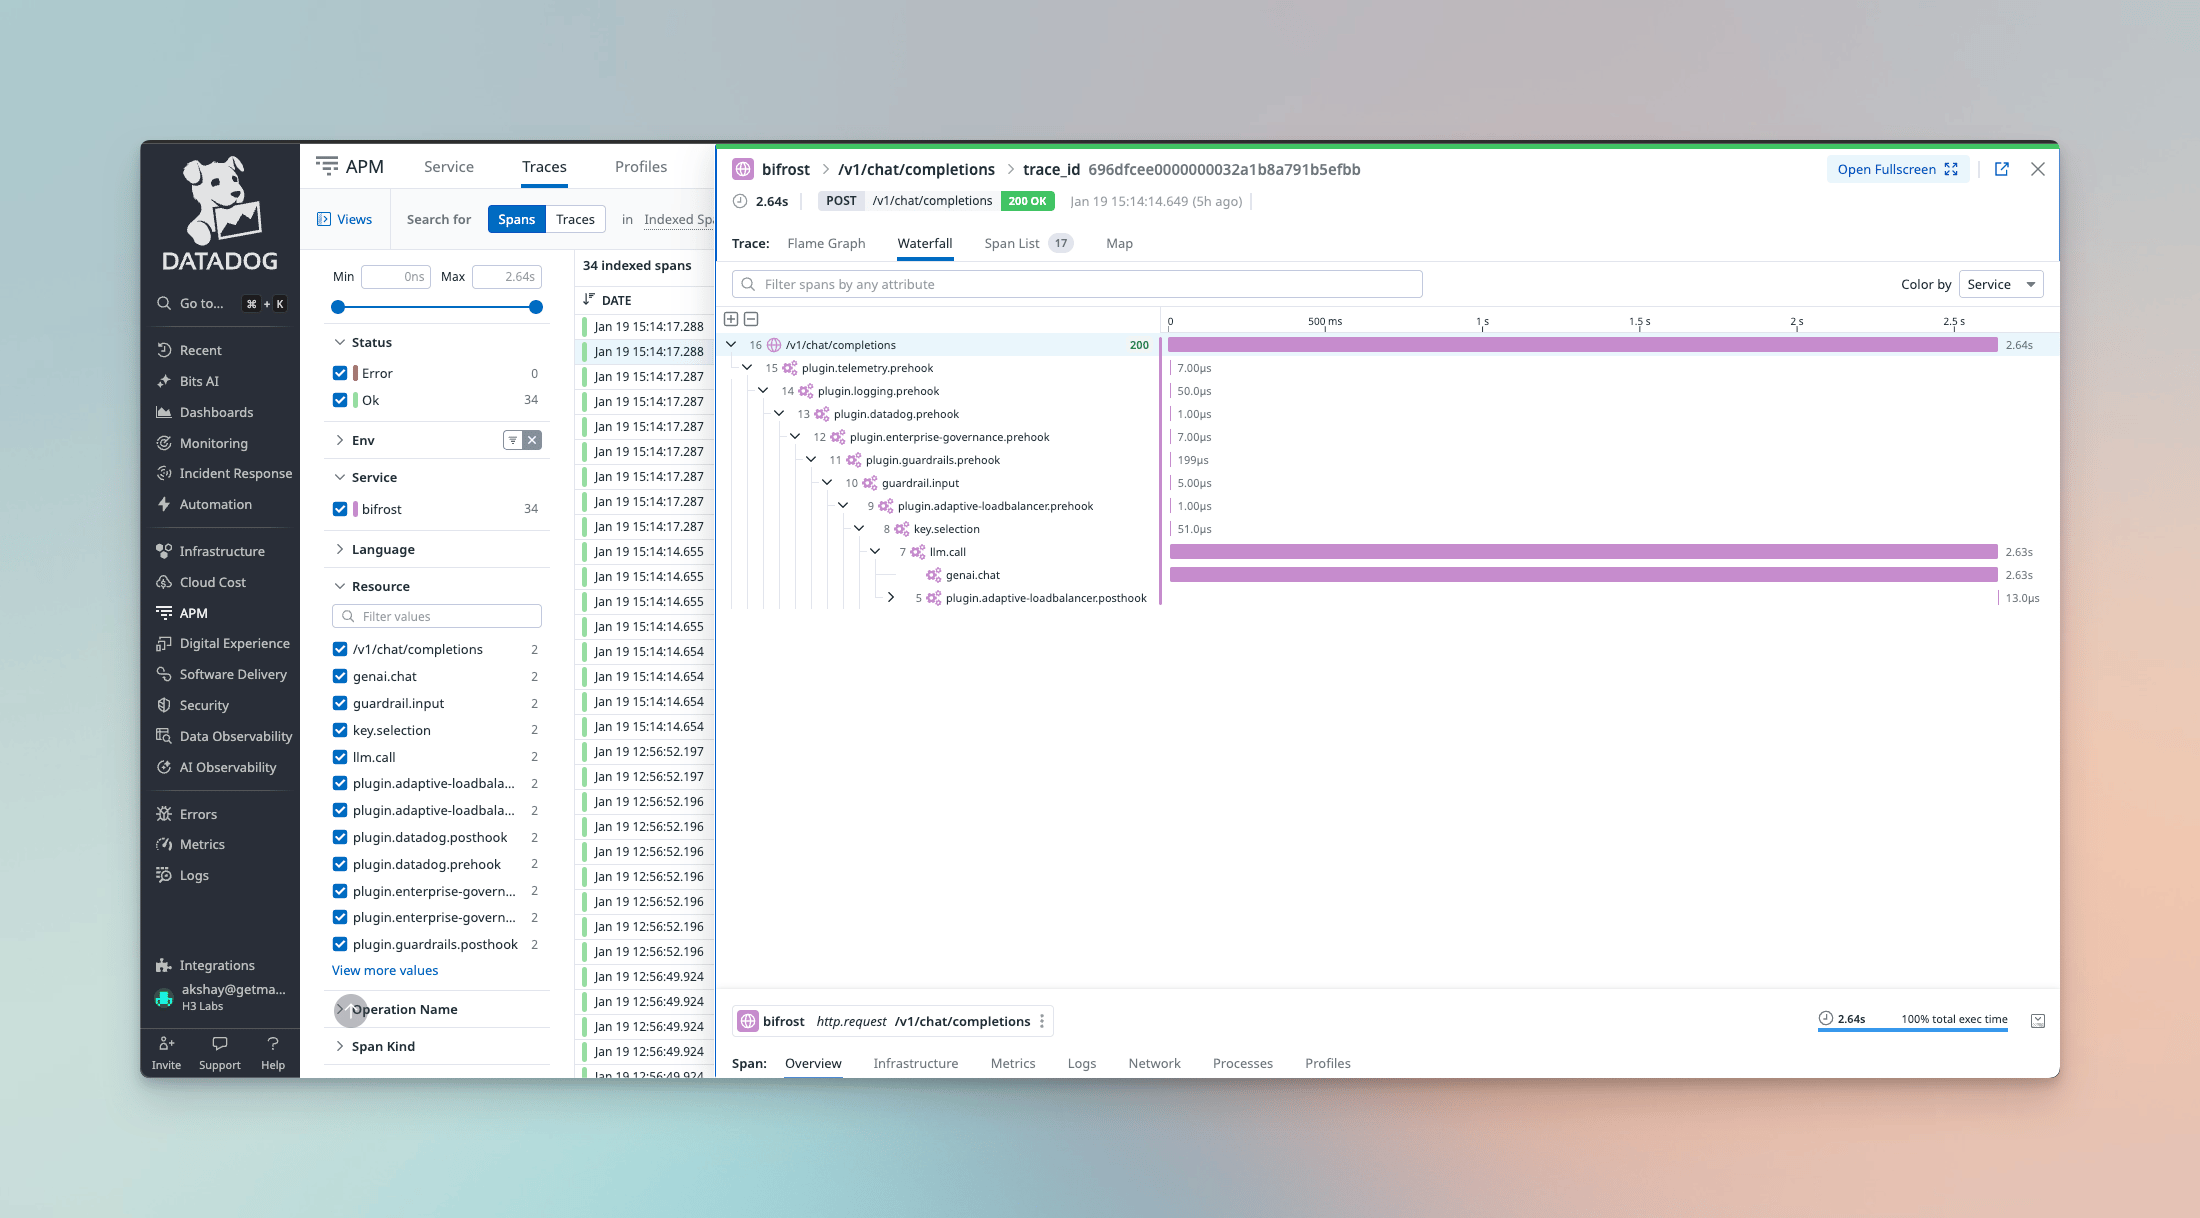
The plugin supports W3C Trace Context for distributed tracing across services. When your upstream service sends atraceparent header, Bifrost automatically links its spans as children of the parent trace.
- End-to-end visibility - See LLM calls in the context of your full application trace
- Cross-service correlation - Link frontend requests → backend services → Bifrost → LLM providers
- Latency attribution - Understand how LLM latency contributes to overall request time
traceparent header format follows the W3C standard:
What’s Captured
For each LLM operation, the plugin sends to LLM Observability:- Input/Output Messages - Full conversation history with role attribution
- Token Usage - Input, output, and total token counts
- Cost - Calculated cost in USD based on model pricing
- Latency - Request duration and time-to-first-token for streaming
- Model Info - Provider, model name, and request parameters
- Tool Calls - Function/tool call details for agentic workflows
Metrics Reference
The plugin emits the following metrics to Datadog:Migrating from bifrost.cost.usd
The cost metric was renamed from bifrost.cost.usd to bifrost.request.cost.usd, and its type changed from Gauge to Distribution. The gauge was last-write-wins per flush window, so concurrent requests with the same tags collapsed to a single value and no query could recover the true total spend. The new name is required because Datadog permanently associates a metric name with its first-seen type per organization — orgs that previously received the gauge cannot receive the same name as a distribution.
Affected assets: any dashboards, monitors, saved views, or alerts that query bifrost.cost.usd.
To migrate:
- Replace
bifrost.cost.usdwithbifrost.request.cost.usdin all queries. - Update aggregations for Distribution semantics — each sample is one request’s cost:
- Total spend:
sum:bifrost.request.cost.usd{*}(do not append.as_count()or.rollup(sum); thesum:aggregator already returns the additive total) - Per-request statistics:
avg:,max:, or percentile aggregators
- Total spend:
- Recreate monitors and alerts on the new metric, adjusting thresholds if they assumed gauge behavior (the gauge systematically under-reported under concurrent load).
bifrost.cost.usd stops receiving data once the upgrade completes; during a rolling deploy both metrics receive data, so update dashboards at or shortly after the upgrade. Historical gauge data remains queryable under the old name for Datadog’s standard retention window.
Custom Tags
All metrics include your configuredcustom_tags plus automatic tags for:
provider- LLM provider (openai, anthropic, etc.)model- Model namemethod- Type of request (chat, embedding, etc.)bifrost_node- Per-instance identity (BIFROST_NODE_IDif set, otherwisehostname-pid)- plus Bifrost-context tags when available (virtual key, selected key, team, customer, fallback index)
Captured Data
Each APM trace includes comprehensive LLM operation metadata:Span Attributes
- Span Name - Based on request type (
genai.chat,genai.embedding, etc.) - Service Info -
service.name,service.version,env(Datadog’s unified service tagging:service,version,env) - Provider & Model -
gen_ai.provider.name,gen_ai.request.model
Request Parameters
- Temperature, max_tokens, top_p, stop sequences
- Presence/frequency penalties
- Tool configurations and parallel tool calls
- Custom parameters via
ExtraParams
Input/Output Data
- Complete chat history with role-based messages
- Prompt text for completions
- Response content with role attribution
- Tool calls and results
- Reasoning and refusal content (when present)
Performance Metrics
- Token usage (prompt, completion, total)
- Cost calculations in USD
- Latency and timing (start/end timestamps)
- Time to first token (streaming)
- Error details with status codes
Bifrost Context
- Virtual key ID and name
- Selected key ID and name
- Team ID and name
- Customer ID and name
- Retry count and fallback index
Plugin Span Filtering
By default every plugin’s pre- and post-hook execution generates a span, which can bloat APM traces when many plugins are active (e.g. 8 built-in plugins × 2 hooks = 16 plugin spans per request). Useplugin_span_filter inside the Datadog plugin config to control which plugin spans are exported. This affects only the exported APM trace spans — plugin execution and metrics are unchanged.
Via config.json (inside the Datadog plugin config):
plugin_span_filter is set in config.json with a higher version value.
Filter modes:
Plugin names: list each plugin using the exact name shown for it in the Configure Plugin Tracing sheet — this is the same name that appears in the span (
plugin.<name>.<stage>), and it is what the filter matches against. Note that some plugins are registered under a different name than their config key: the enterprise prompts and governance plugins appear as enterprise-prompts and enterprise-governance (not prompts/governance). Common names include telemetry, logging, otel, semantic_cache, compat, maxim, enterprise-prompts, enterprise-governance, datadog, bigquery, guardrails, adaptive-loadbalancer, and model-catalog-resolver. The exact set depends on which plugins are loaded in your deployment.
When a plugin span is filtered out, its children are automatically re-parented to the nearest exported ancestor so the trace hierarchy stays connected. The filter applies to APM trace spans only; it does not change DogStatsD metrics, which are never derived from plugin spans.
Each observability connector has its own independent
plugin_span_filter — filtering plugin spans for Datadog does not affect OTEL, BigQuery, or any other connector. plugin_span_filter follows the standard plugin config precedence rules; to make a config.json value override UI-saved DB settings on restart, set a higher version on the Datadog plugin entry (e.g. "version": 2). See Plugin Versioning for details.Supported Request Types
The Datadog plugin captures all Bifrost request types:When to Use
Datadog Plugin
Choose the Datadog plugin when you:- Use Datadog as your primary observability platform
- Want native LLM Observability integration with ML App grouping
- Need seamless correlation with existing Datadog APM traces via W3C distributed tracing
- Require Datadog-specific features like notebooks and dashboards
- Want session tracking for conversation flows
vs. OTel Plugin
Use the OTel plugin when you:- Need multi-vendor observability (send to multiple backends)
- Are using Datadog via an OpenTelemetry Collector
- Want vendor flexibility to switch backends without code changes
- Prefer standardized OpenTelemetry semantic conventions
You can use both plugins simultaneously if needed. The Datadog plugin provides native integration while OTel can send to additional backends.
vs. Built-in Observability
Use Built-in Observability for:- Local development and testing
- Simple self-hosted deployments
- No external dependencies required
- Direct database access to logs
Troubleshooting
Agent Connectivity Issues
Verify the Datadog Agent is running and accessible:Agentless Mode Not Working
- Verify your API key is valid:
-
Ensure the
sitematches your API key’s region - Check that the API key environment variable is set:
Missing Traces
- Enable debug logging in Bifrost:
- Verify traces are enabled in your configuration:
- Check for errors in the Bifrost logs related to the Datadog plugin
Missing Metrics
- Verify DogStatsD is running (agent mode):
- Ensure metrics are enabled:
- For agentless mode, verify your API key has metrics submission permissions
LLM Observability Not Appearing
- LLM Observability requires
enable_llm_obs: true(default) - Verify your Datadog plan includes LLM Observability
- Check the ML App name in Datadog under LLM Observability → Applications
Next Steps
- OTel Plugin - OpenTelemetry integration for multi-vendor observability
- Built-in Observability - Local logging for development
- Telemetry - Prometheus metrics and dashboards