
Adaptive routing records what it saw and what it changed on every node. The Dashboard shows that history over time, Incidents lists every problem it found, and each request log shows what adaptive routing decided for that request.

What is recorded

  • Every minute, each node records the state of every provider and key it routes, including any hold.
  • As it happens, each node records state changes, holds, checks and releases, edits to keys and providers, and changes to the adaptive routing settings.
  • History is stored in the logs database, so it needs a Postgres or ClickHouse log store.
  • History is kept for History Retention (days), 7 by default. The cluster leader deletes older history once a day.
  • With Record Routing History off, nothing new is recorded and the dashboard shows the time since as No data. Routing is the same either way, and what adaptive routing decided for each request is still written to its request log.
Both settings are on the settings page.

The dashboard

Open Adaptive Routing > Dashboard in the sidebar. The dashboard and the incidents page need AdaptiveRouter: View (see RBAC).
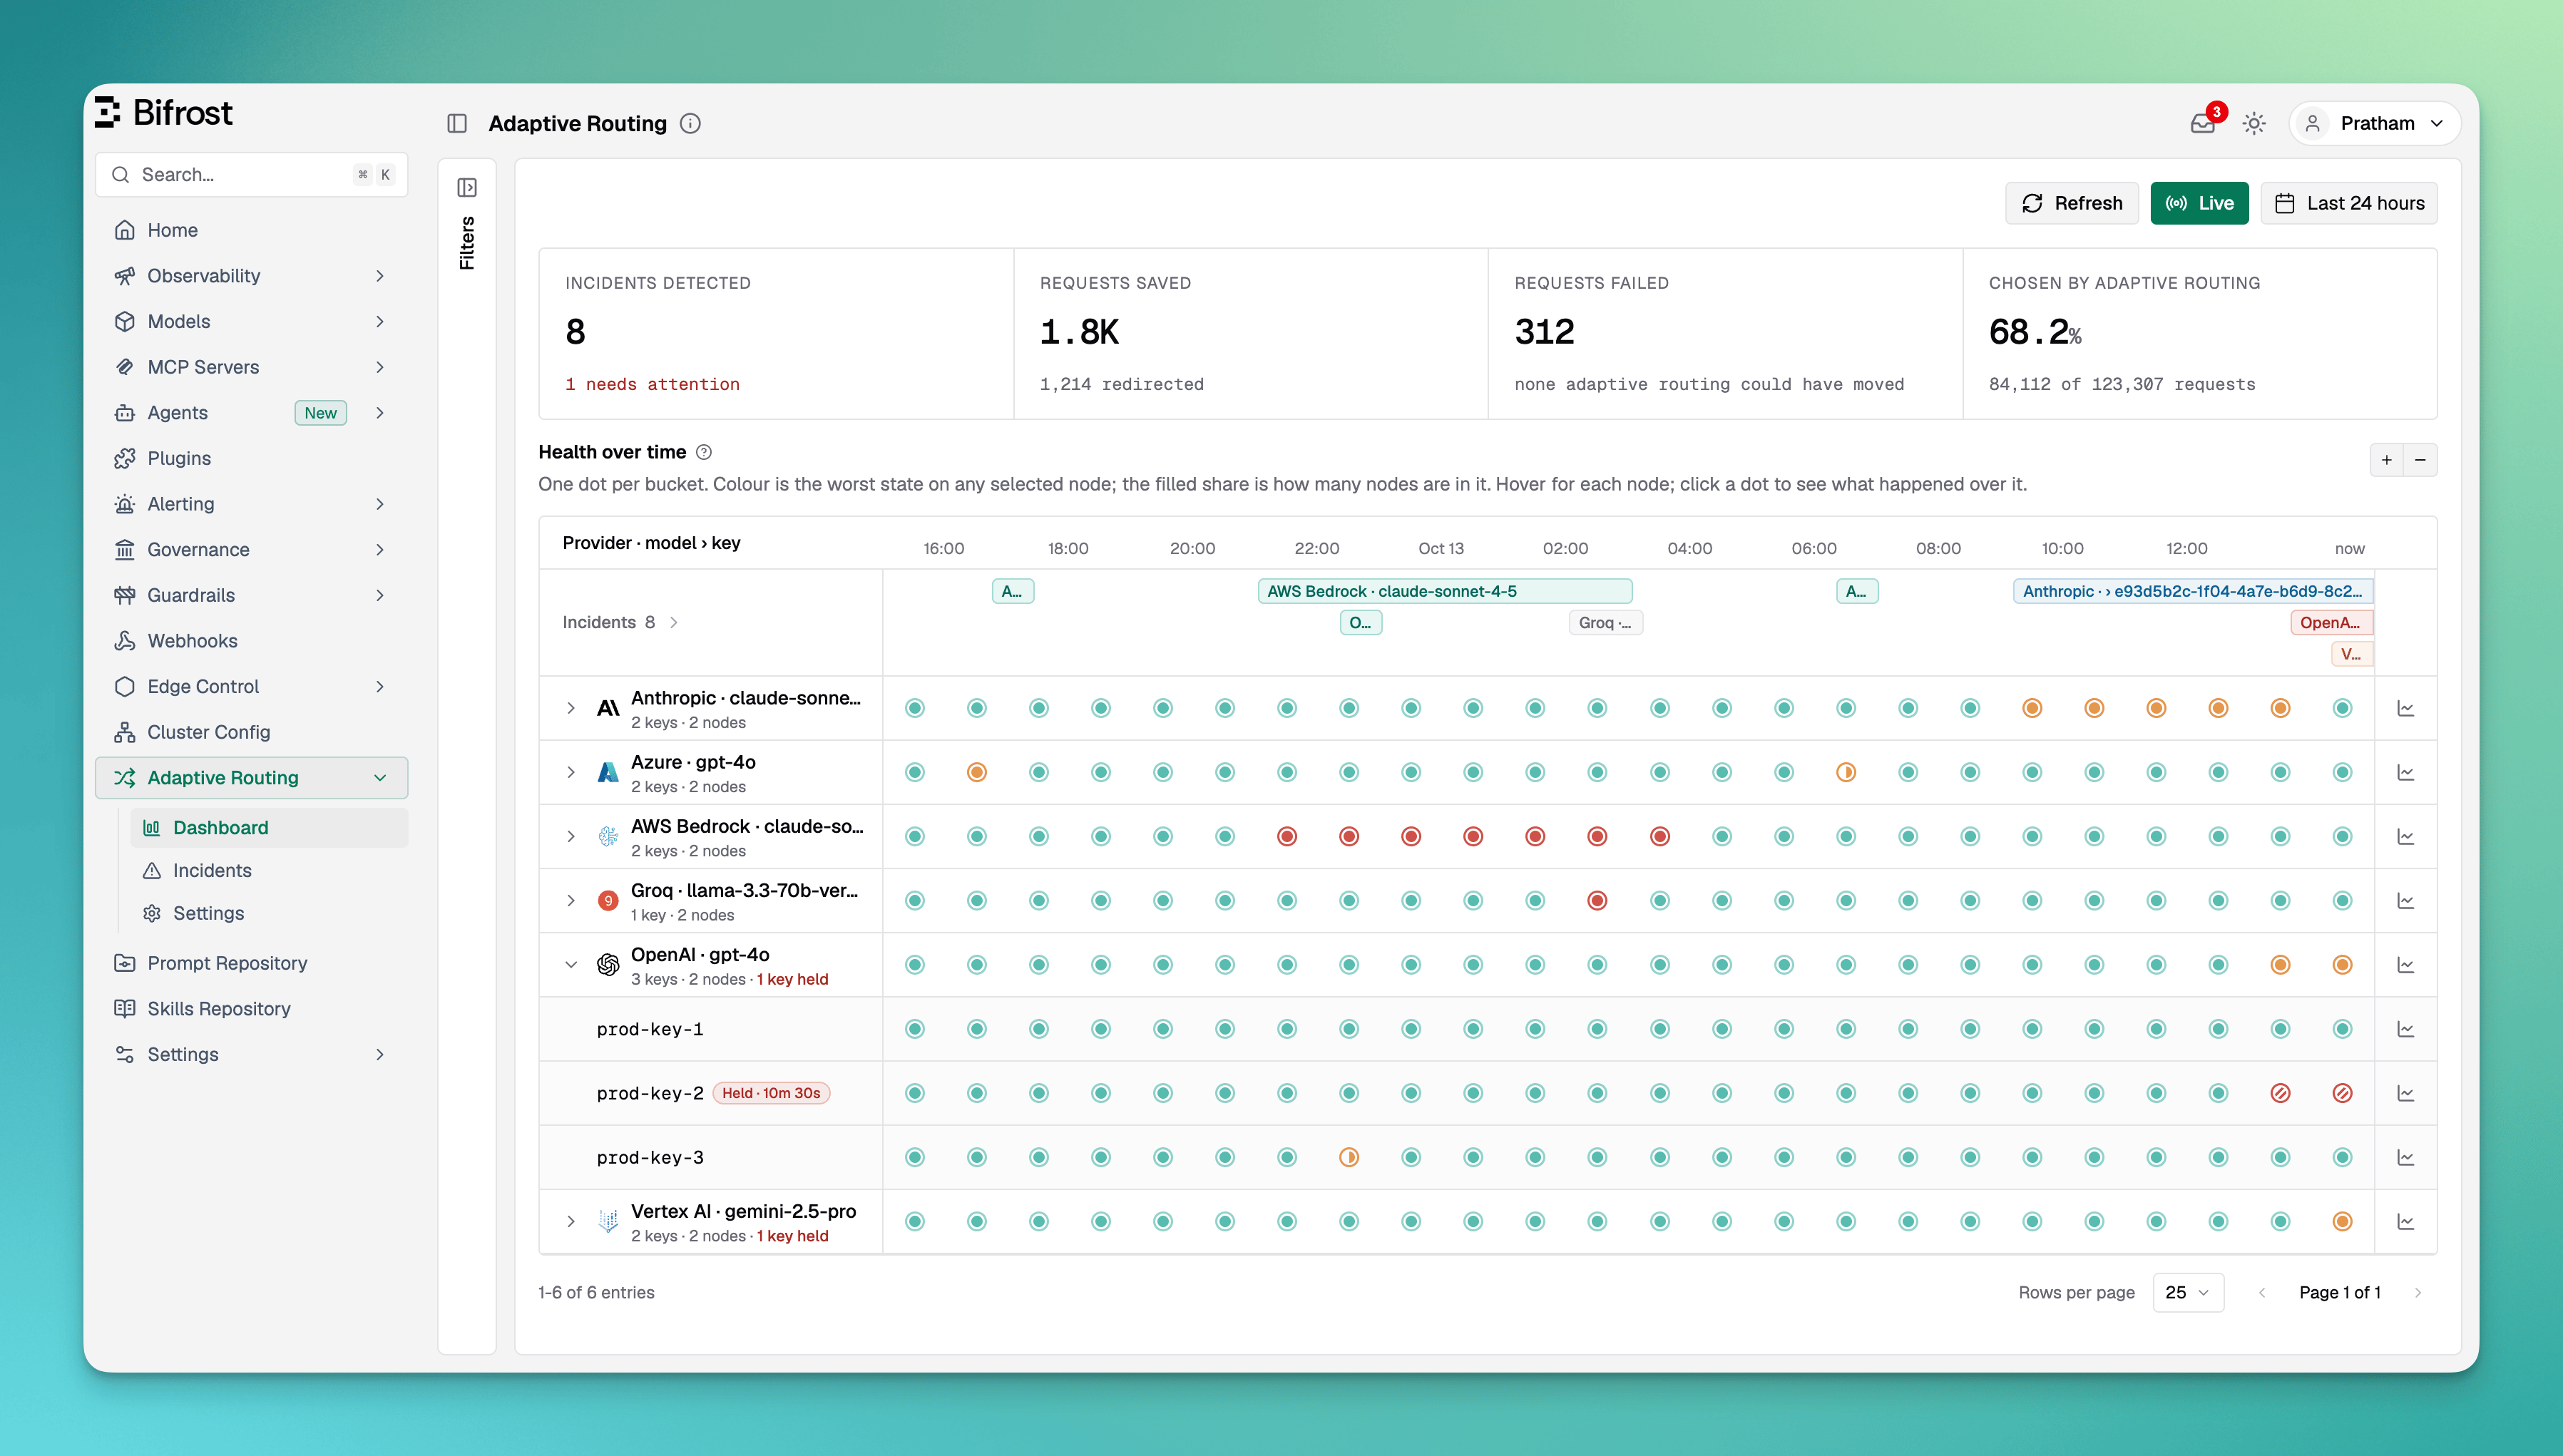
The Adaptive Routing dashboard with Refresh, Live and the time window, four figures for incidents, requests saved, requests failed and requests chosen by adaptive routing, and the Health over time timeline with an incidents lane and one row per provider and model
Live refreshes the dashboard every minute. The time window offers the last hour, 6 hours, 24 hours, 7 days and 30 days, limited to the history retention, or a custom range. The Filters panel narrows everything on the page by provider, model, region, node, held-key reason, or to Held now only.

Figures

Click a figure for its breakdown.

Health over time

The timeline has one row per provider and model. Expand a row to see its keys.
  • Each dot covers a stretch of time. Its colour is the worst state on any selected node in that stretch, and the filled share of the dot is how many nodes were in that state. Hover a dot for each node; click it to see what happened in that stretch.
  • A hatched dot is a key held because the provider refused it.
  • A grey dashed dot means no node was recording, because the cluster was down or history was off.
  • A small mark on a dot, with a matching mark on the time axis, means a node wrote no samples for part of that stretch, for example because its process was paused.
  • The Incidents lane above the rows shows each incident as a bar over the time it lasted. Click a bar to open the incident.
  • Drag across the timeline to zoom into a range, or use the zoom buttons.
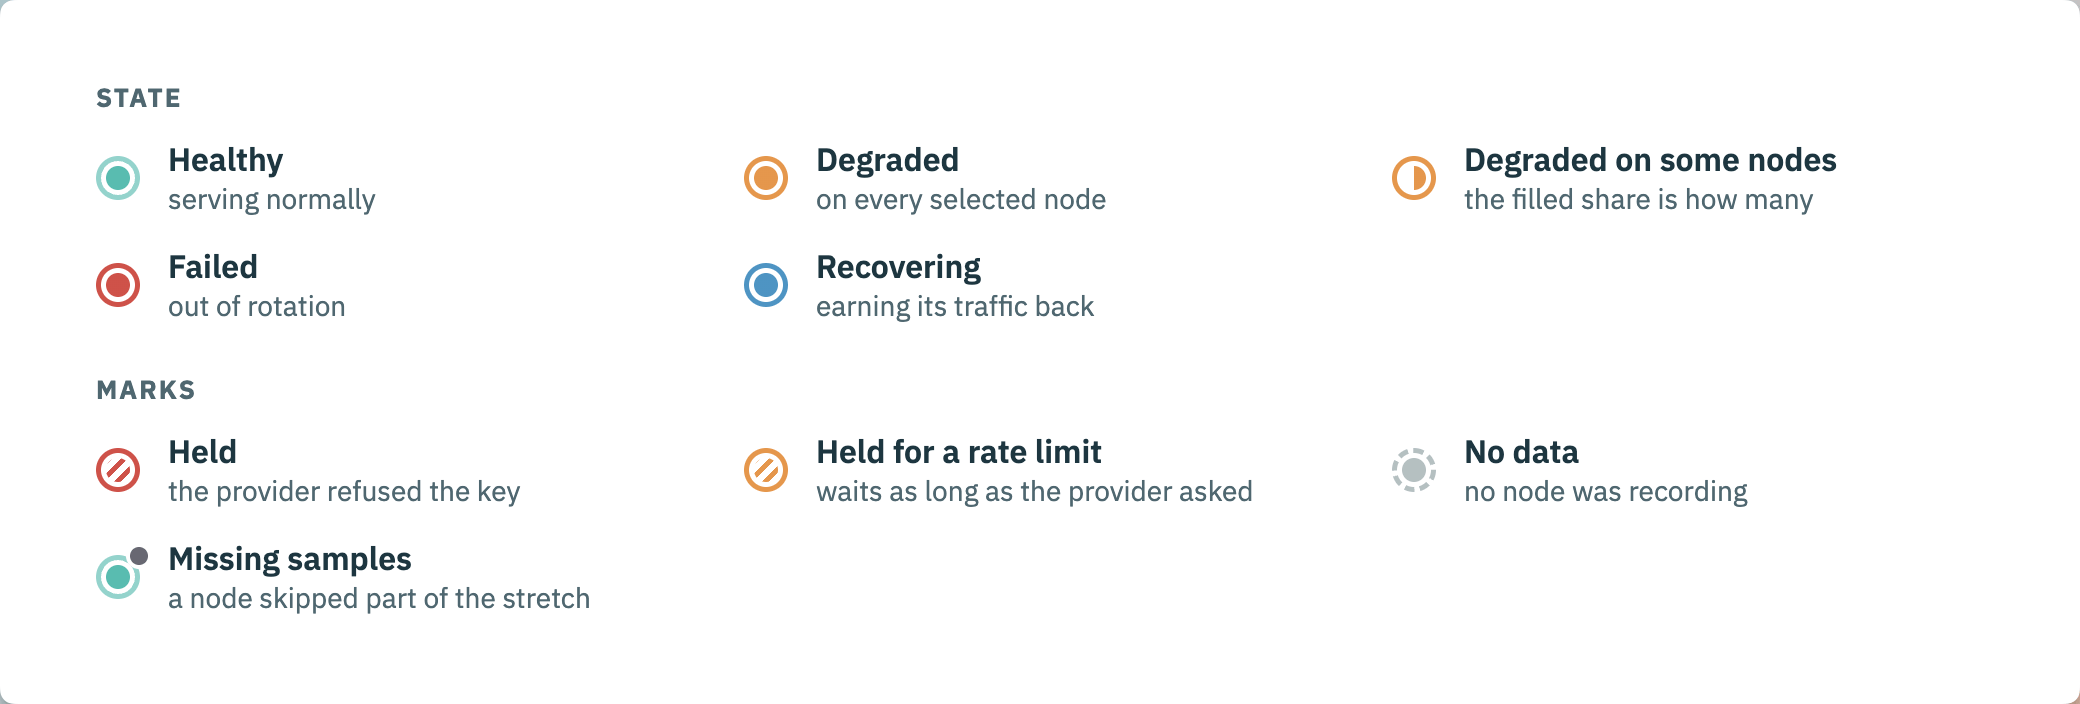
Timeline legend. States: Healthy, Degraded, Degraded on some nodes with a partly filled dot, Failed, Recovering. Marks: Held with red hatching, Held for a rate limit with amber hatching, No data as a dashed grey dot, and Missing samples as a small mark on the dot.
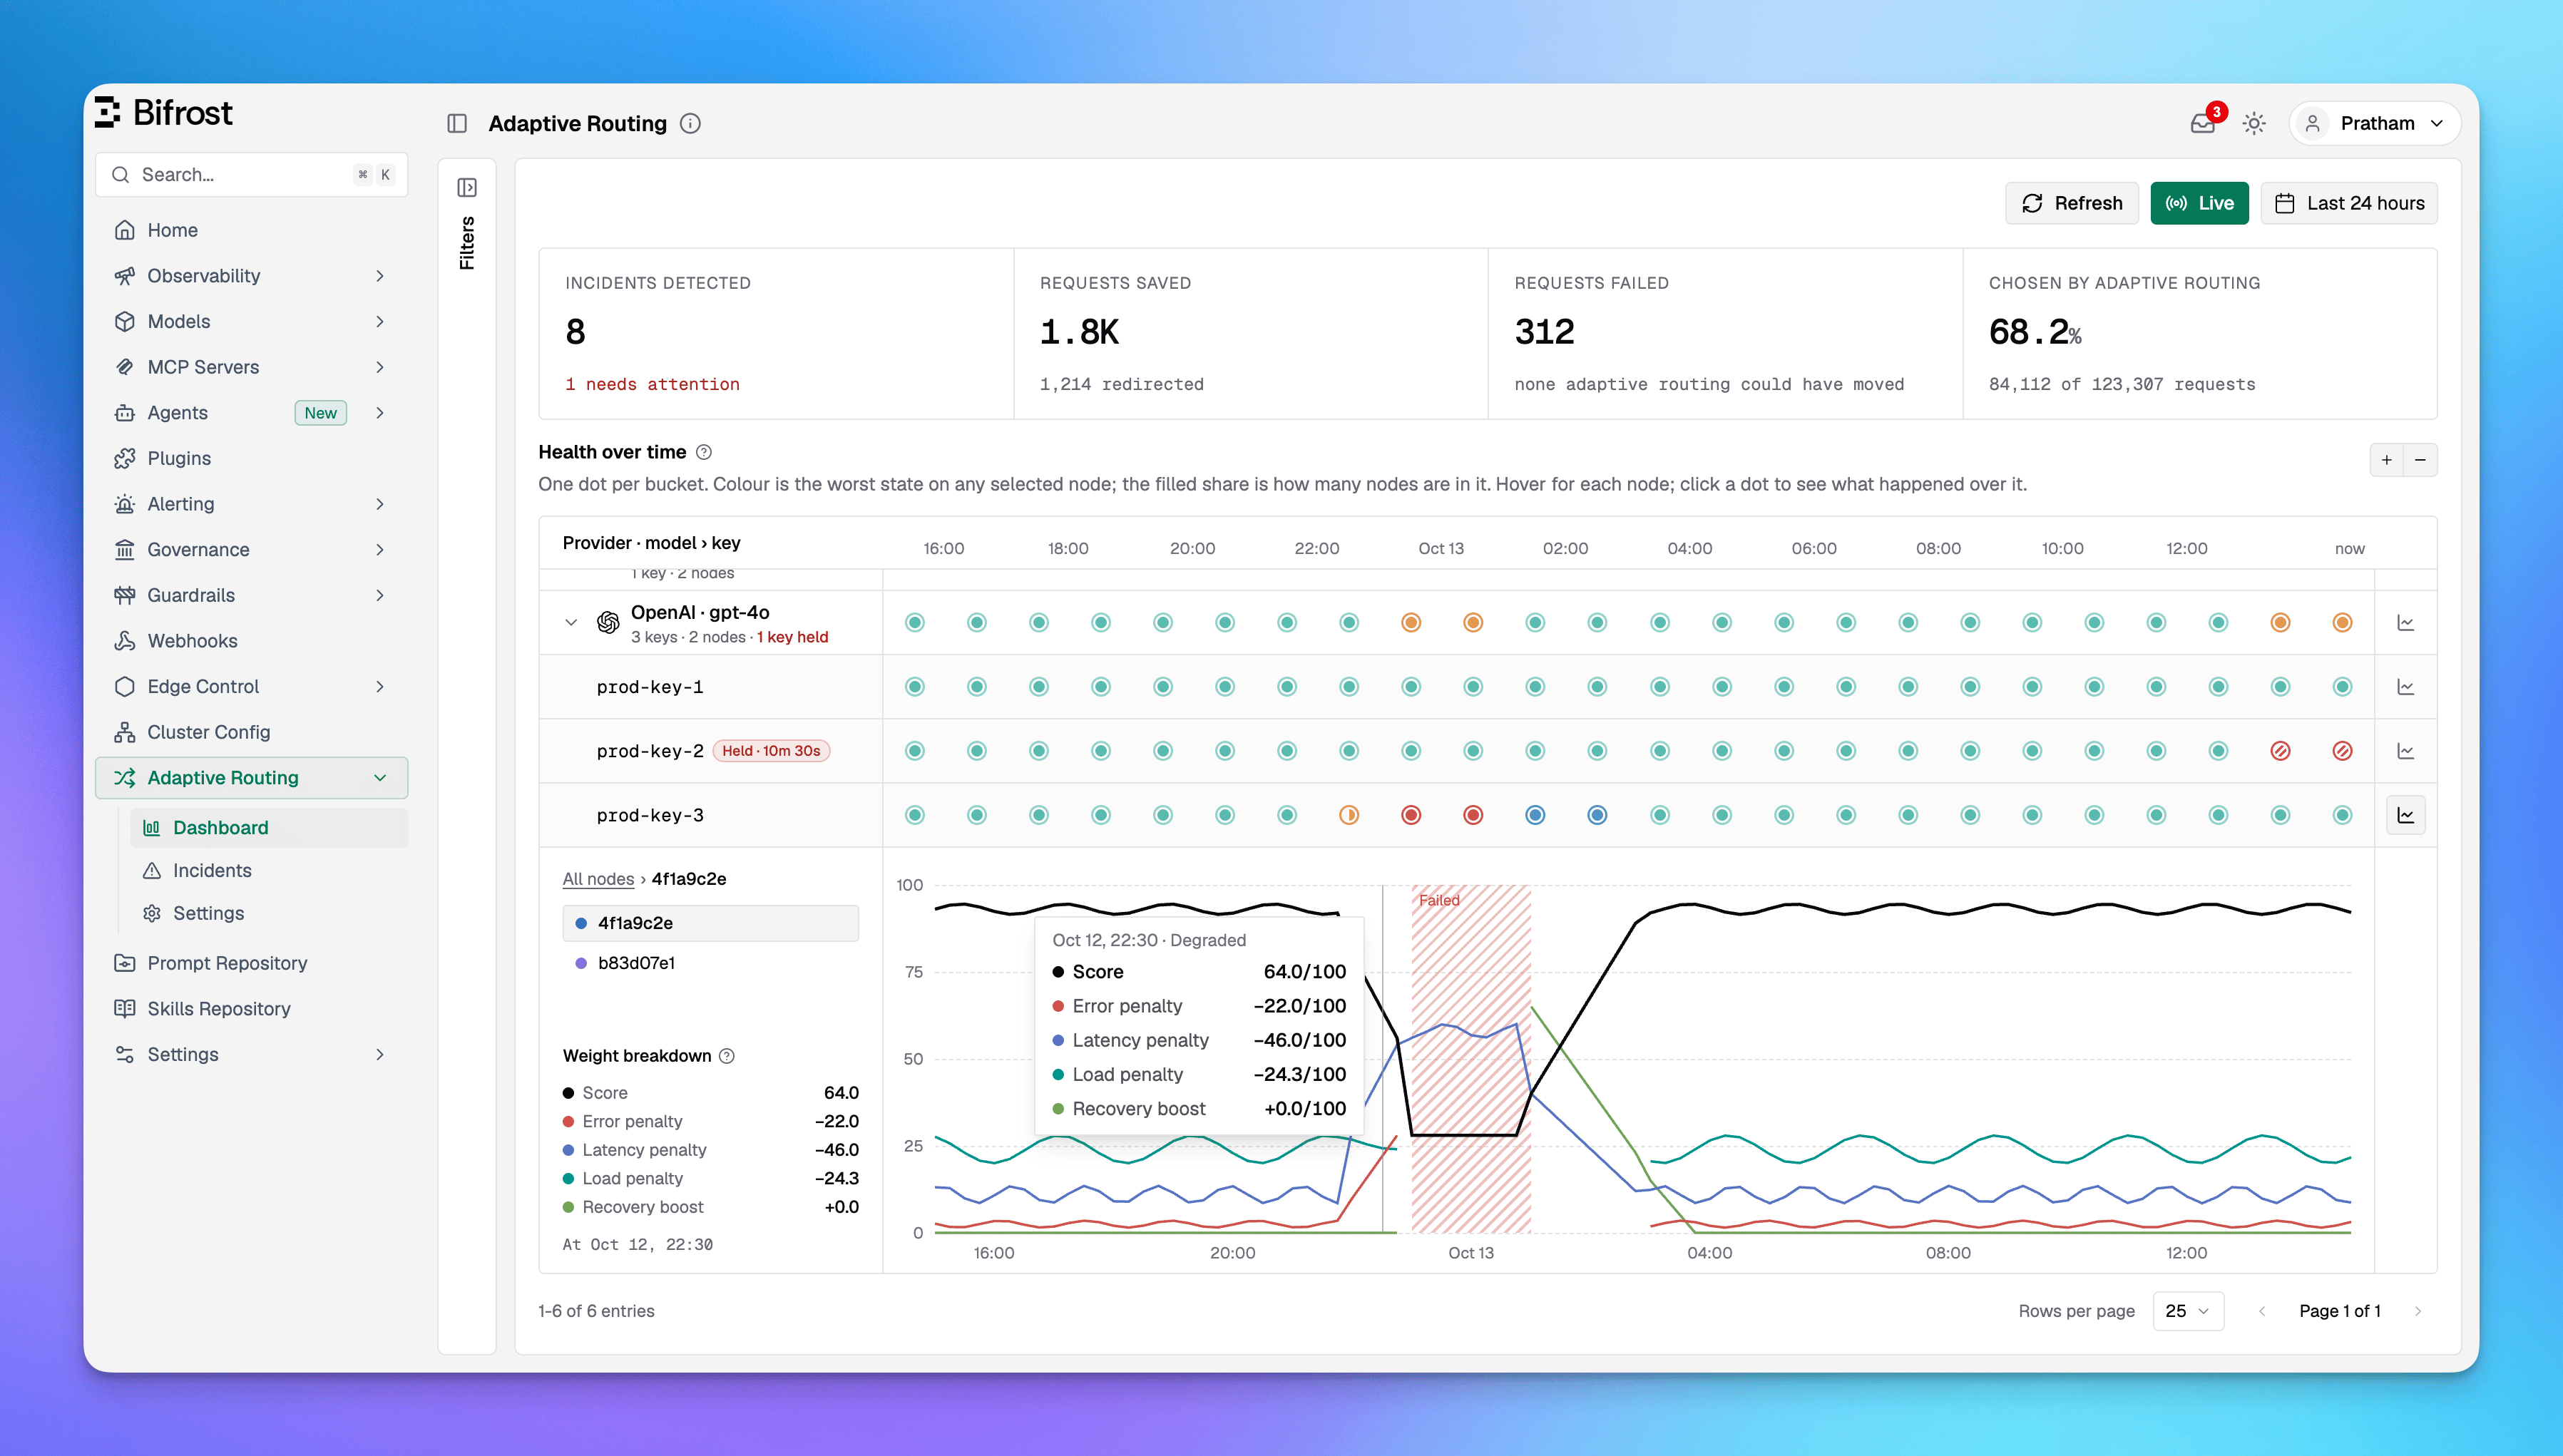
The ? next to Health over time shows the same legend in the app. The chart button at the end of a row opens its routing score: the score each node gave the provider or key over time, out of 100. Pick a node to see what lowered the score (error, latency and load penalties) and what raised it (the recovery boost). Each is its own score out of 100, combined inside adaptive routing, so they do not add up to the gap below 100.
The OpenAI gpt-4o row open with 1 key held, prod-key-2 showing a Held chip, and the routing score of prod-key-3 for one node: the score falls while the error and latency penalties rise, drops into a Failed stretch, and climbs back with the recovery boost, with the weight breakdown for the hovered moment beside the chart
A provider row with held keys shows N keys held, and each held key row shows a Held chip. Click either to open Held keys.

Incidents

An incident is one problem adaptive routing saw, on one of:
  • Provider · model: a provider failing or degraded for a model.
  • Key on a model: one key failing or held for one model.
  • Key, every model: one key held for every model, such as a rejected credential.
What every node saw of the same problem is merged into one incident, with each node’s part shown in its details.

Statuses

An incident needs attention when: A held key stops needing attention once its hold is released.

The incidents page

Open Adaptive Routing > Incidents in the sidebar.
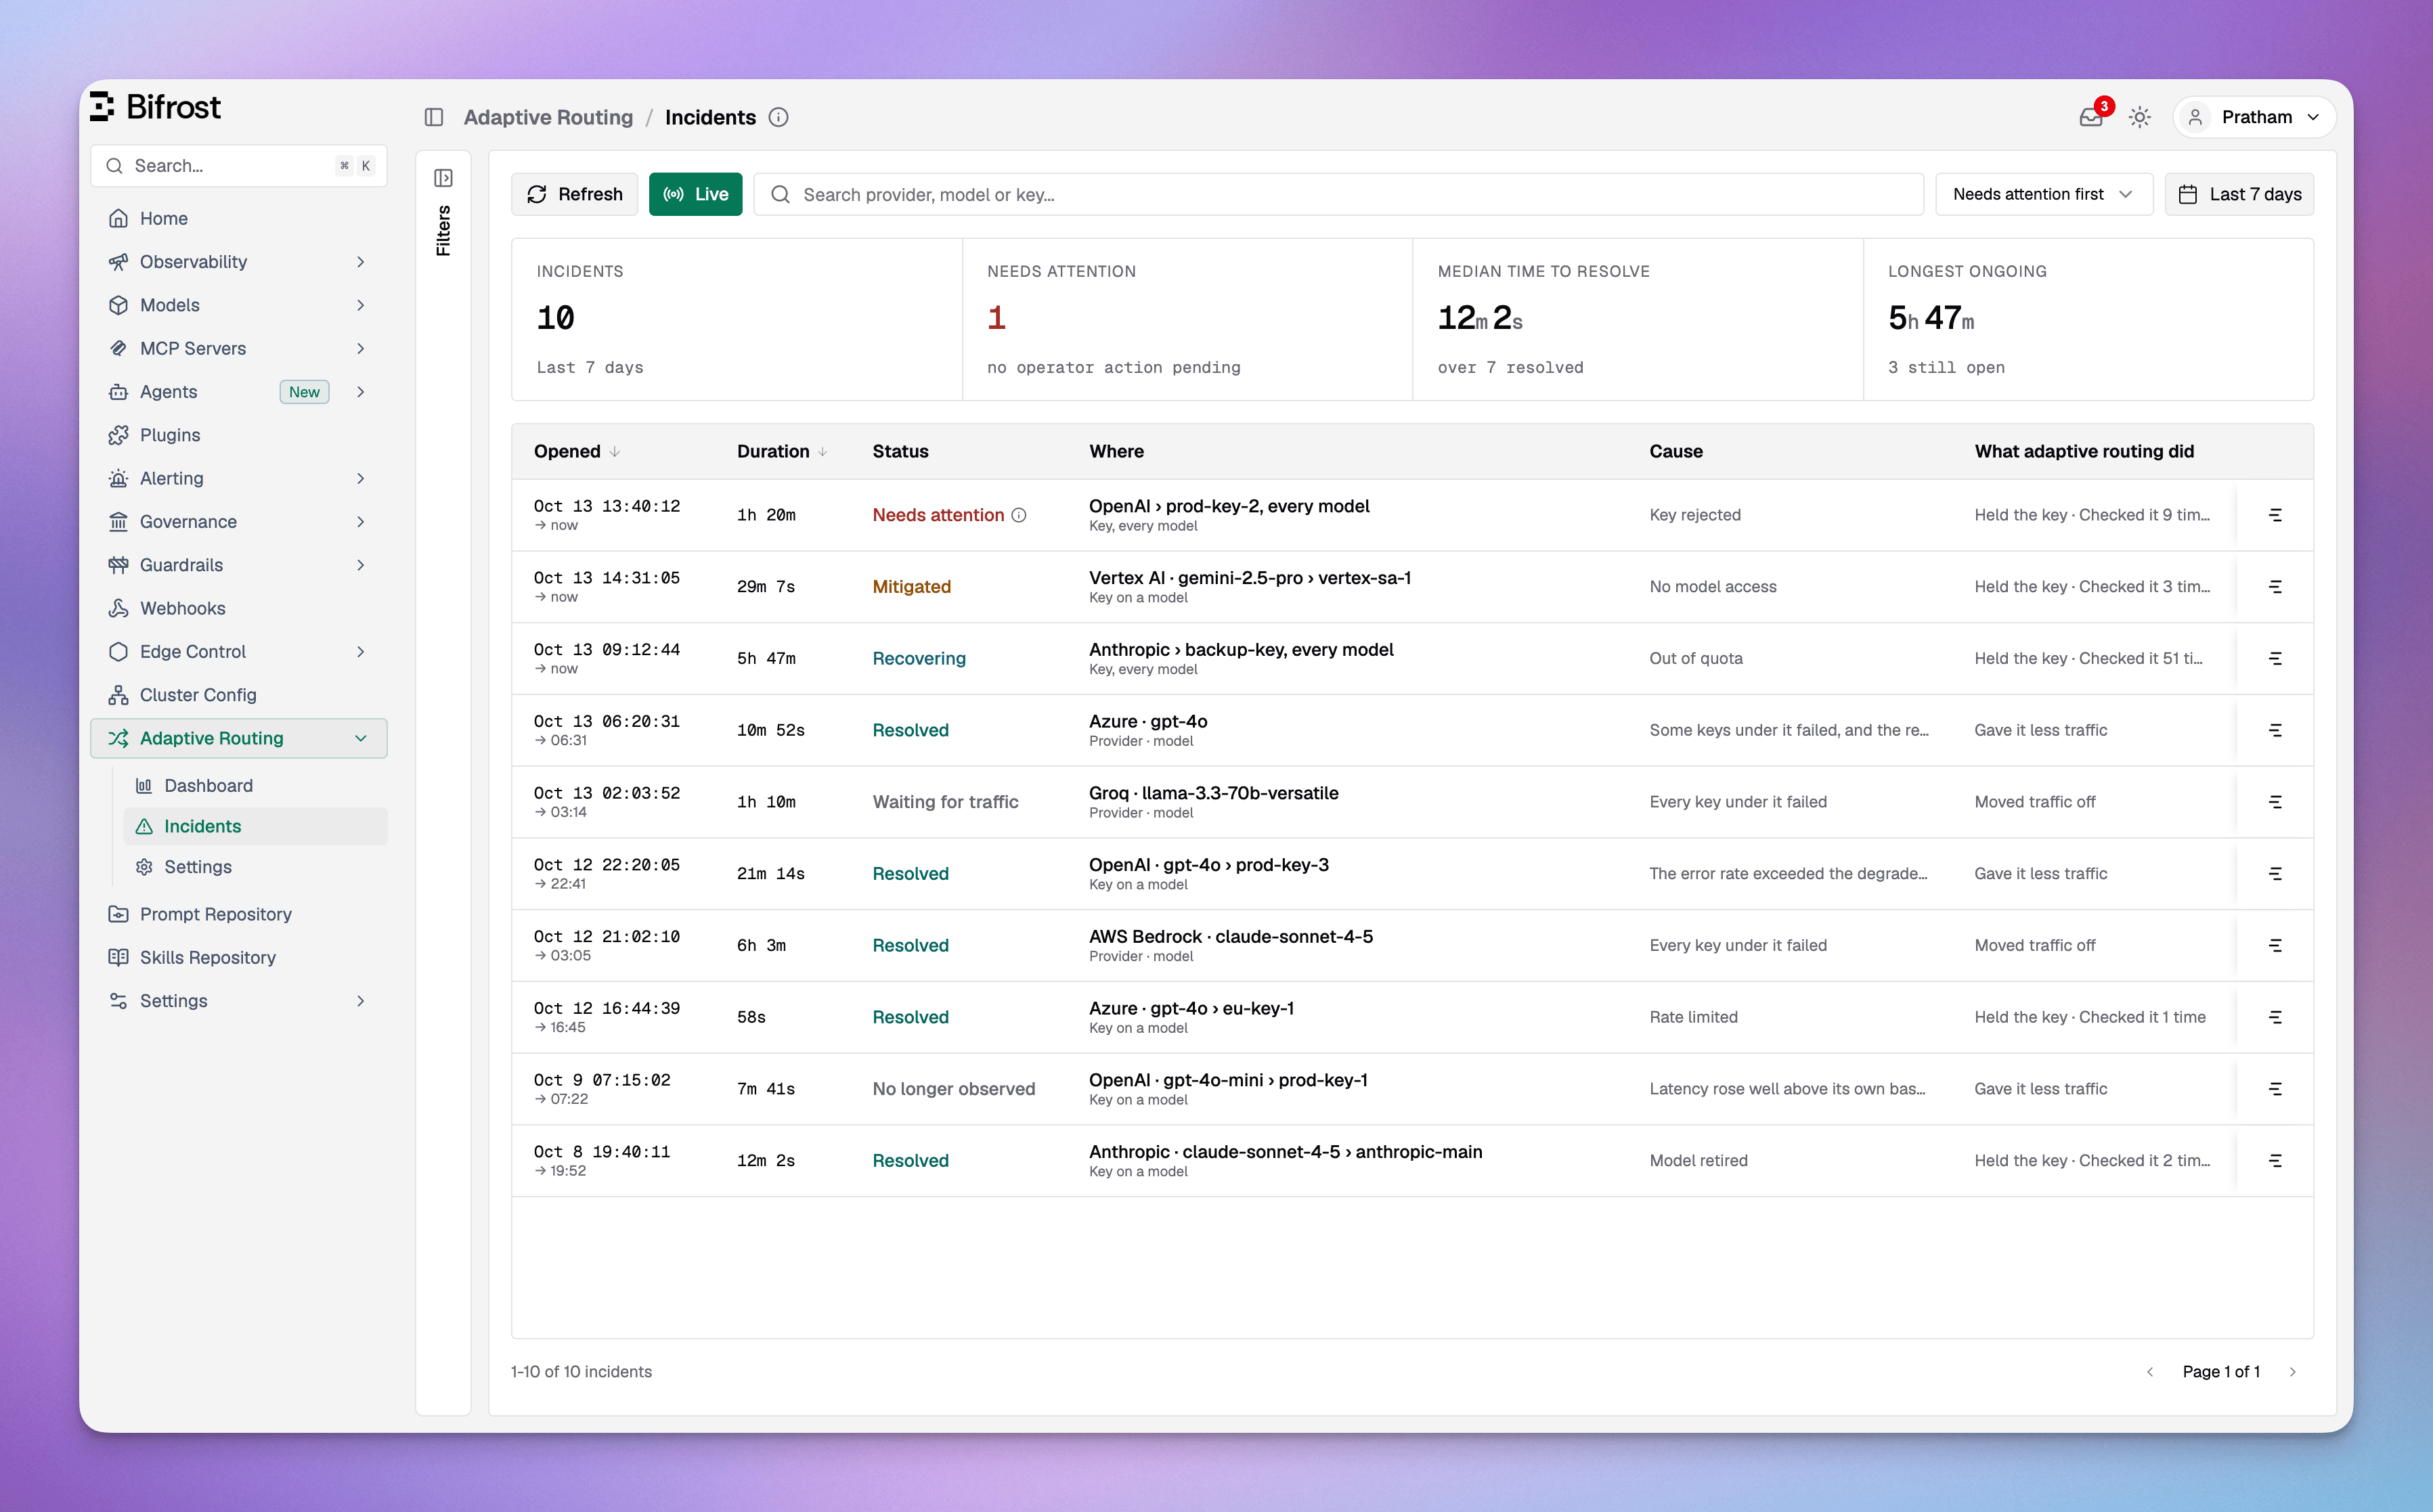
The Incidents page with search, sort and the time window, four figures for incidents, needs attention, median time to resolve and longest ongoing, and a table of incidents with when they opened, duration, status, where, cause and what adaptive routing did
Each row shows when the incident opened, how long it lasted, its status, where it happened, its cause and what adaptive routing did about it: Held the key, Moved traffic off, Gave it less traffic, and how many times it checked a held key. The chart button shows the incident on the dashboard timeline. Filter by status, provider, model, reason, worst state, scope, region and node; each value shows how many incidents it matches. Search matches provider, model or key. Sort by needs attention first, newest, oldest, longest or shortest. The page shares the dashboard’s time window, Live mode and filters, so moving between them keeps your view.

Incident details

Click an incident on either page to open its details. Use the arrows to move through the list.
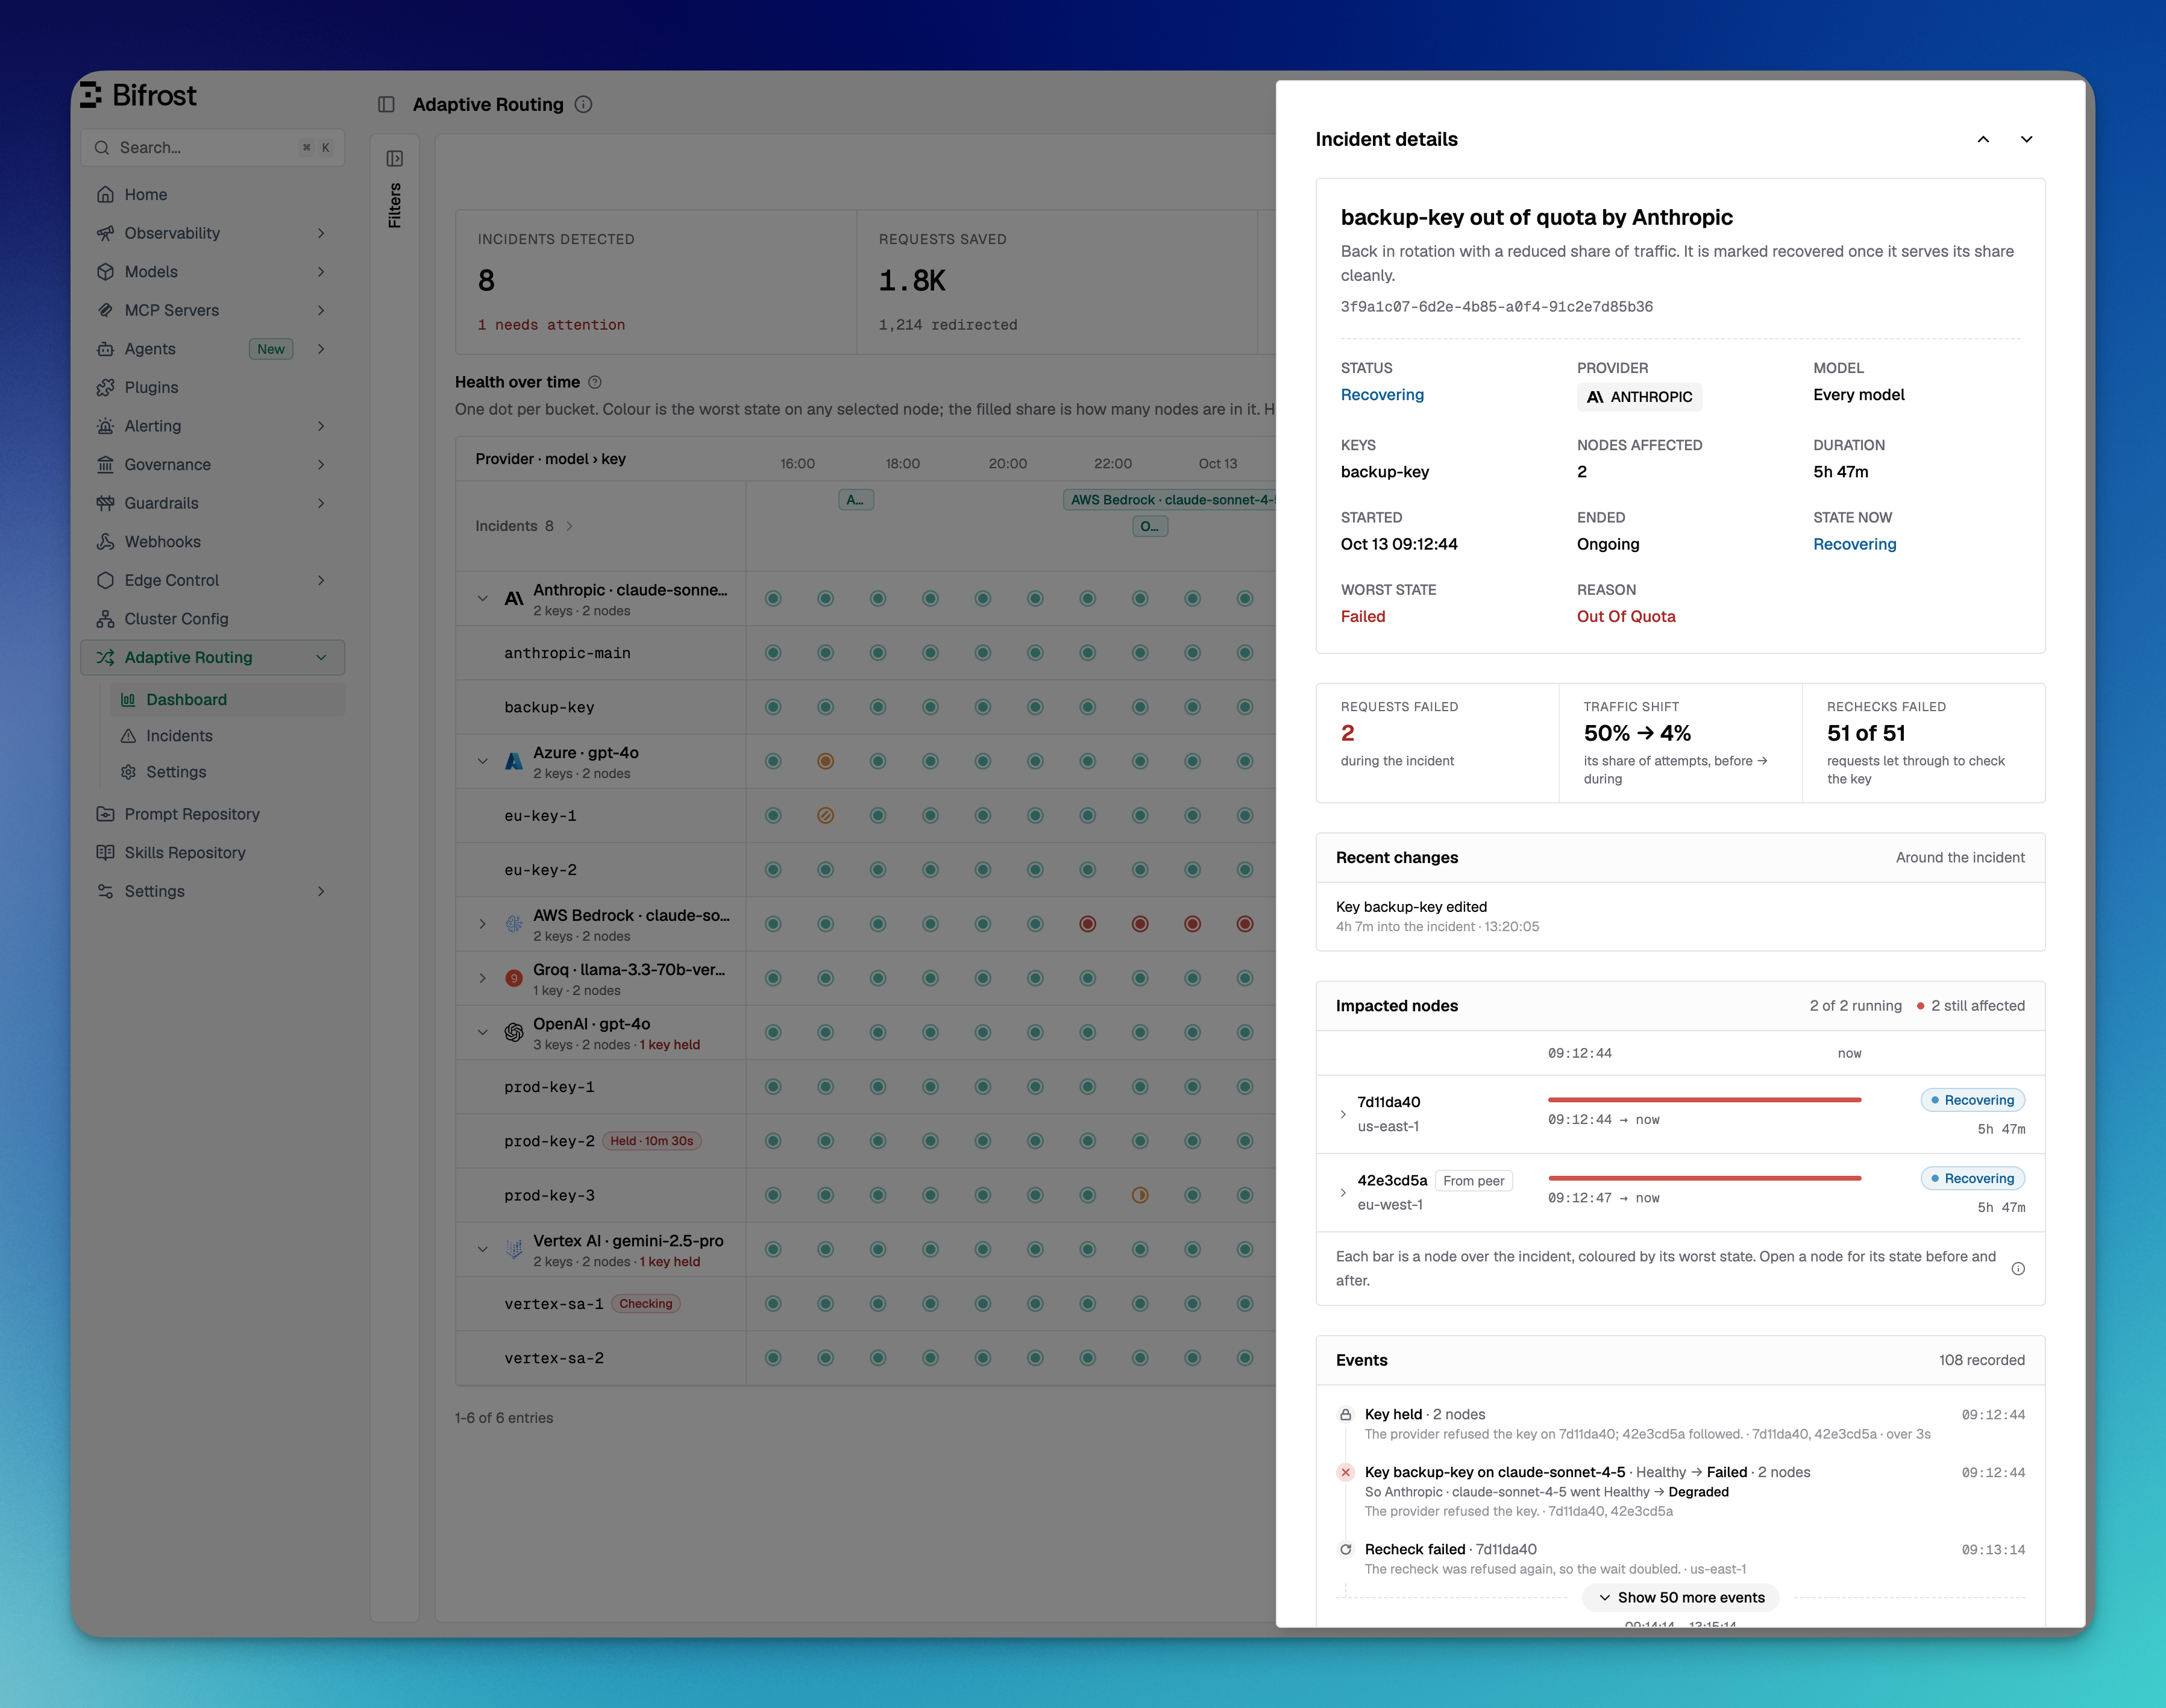
Incident details open over the dashboard for a key out of quota that is now recovering, showing the overview, figures, a recent key edit, the impacted nodes and the events

In the request logs

What adaptive routing decided for a request is written to its log, whether or not history is recorded. Open a request in Logs and its Routing tab starts with the Adaptive Routing card.
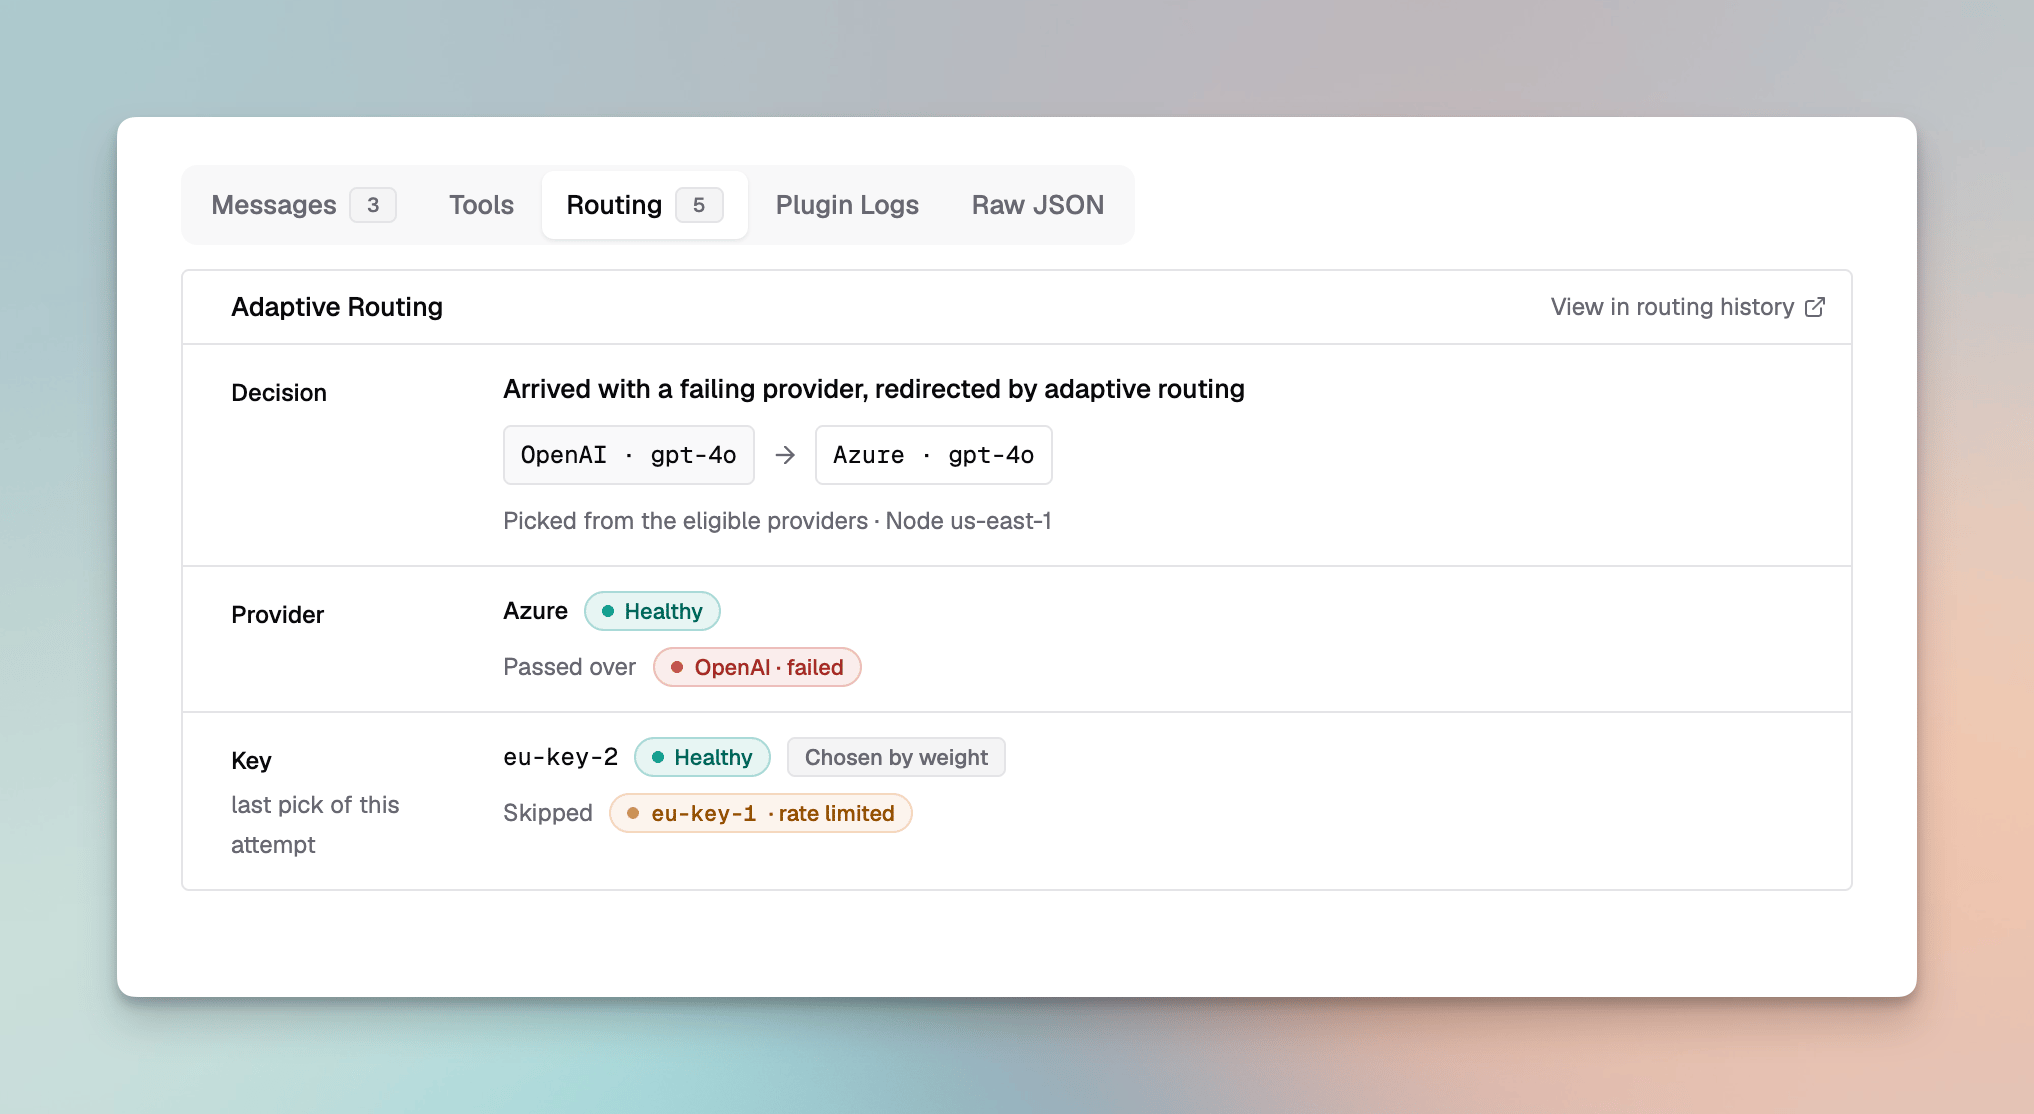
The Adaptive Routing card in a request's Routing tab: a request that named a failing OpenAI was redirected to Azure, with OpenAI passed over as failed and a rate limited key skipped
View in routing history opens the dashboard on the hour around the request, filtered to its provider. The Logs filters have an Adaptive Routing group to find requests by these decisions, for example every request redirected away from the provider it named, or every attempt that was the check of a held key.
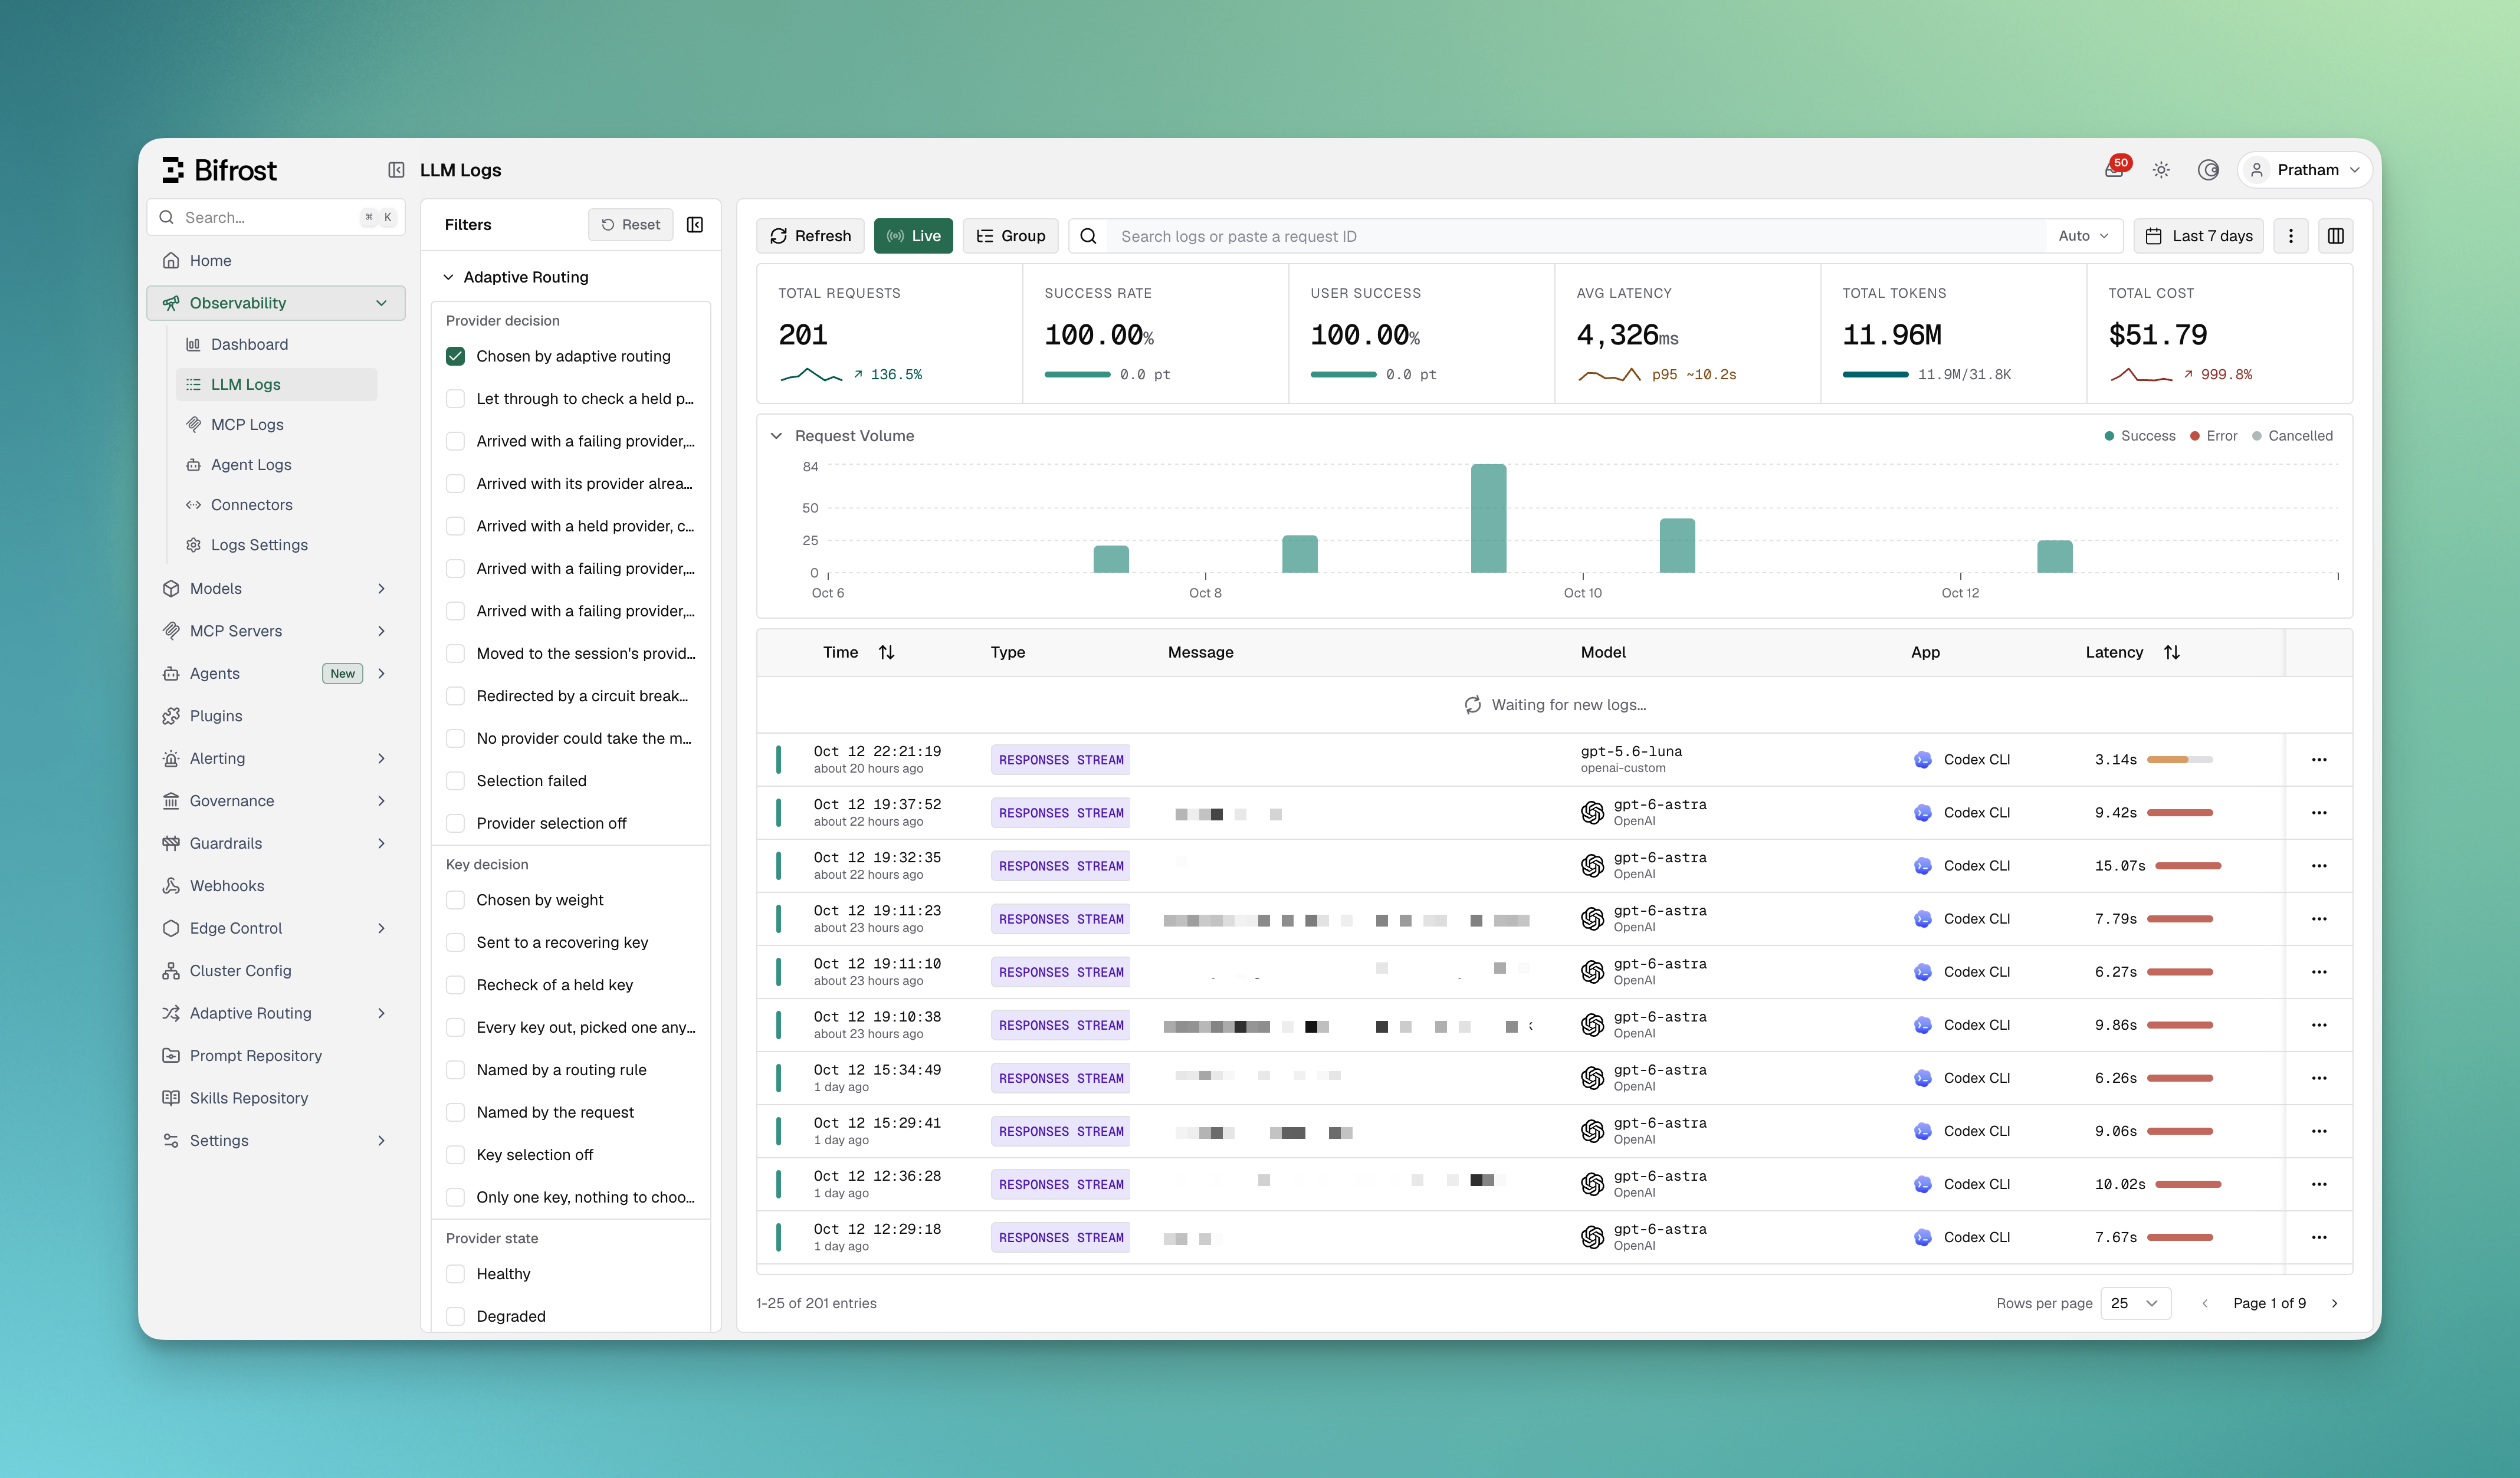
The LLM Logs page with the Adaptive Routing filter group open in the Filters panel, listing provider decisions such as Chosen by adaptive routing and key decisions such as Chosen by weight, next to the request table
These values are stored in the log’s metadata, under keys that start with bifrost_alb_. You can filter on them through the logs API with a metadata_ parameter, such as metadata_bifrost_alb_decision=pinned_rerouted, or read them from log exports. Provider-level fields are on a request’s first attempt. Key-level fields describe the last key picked for each attempt.

Common cases

Each case below is an illustration that puts the case’s rows from the dashboard timeline above its row on the Incidents page.

Key rejected

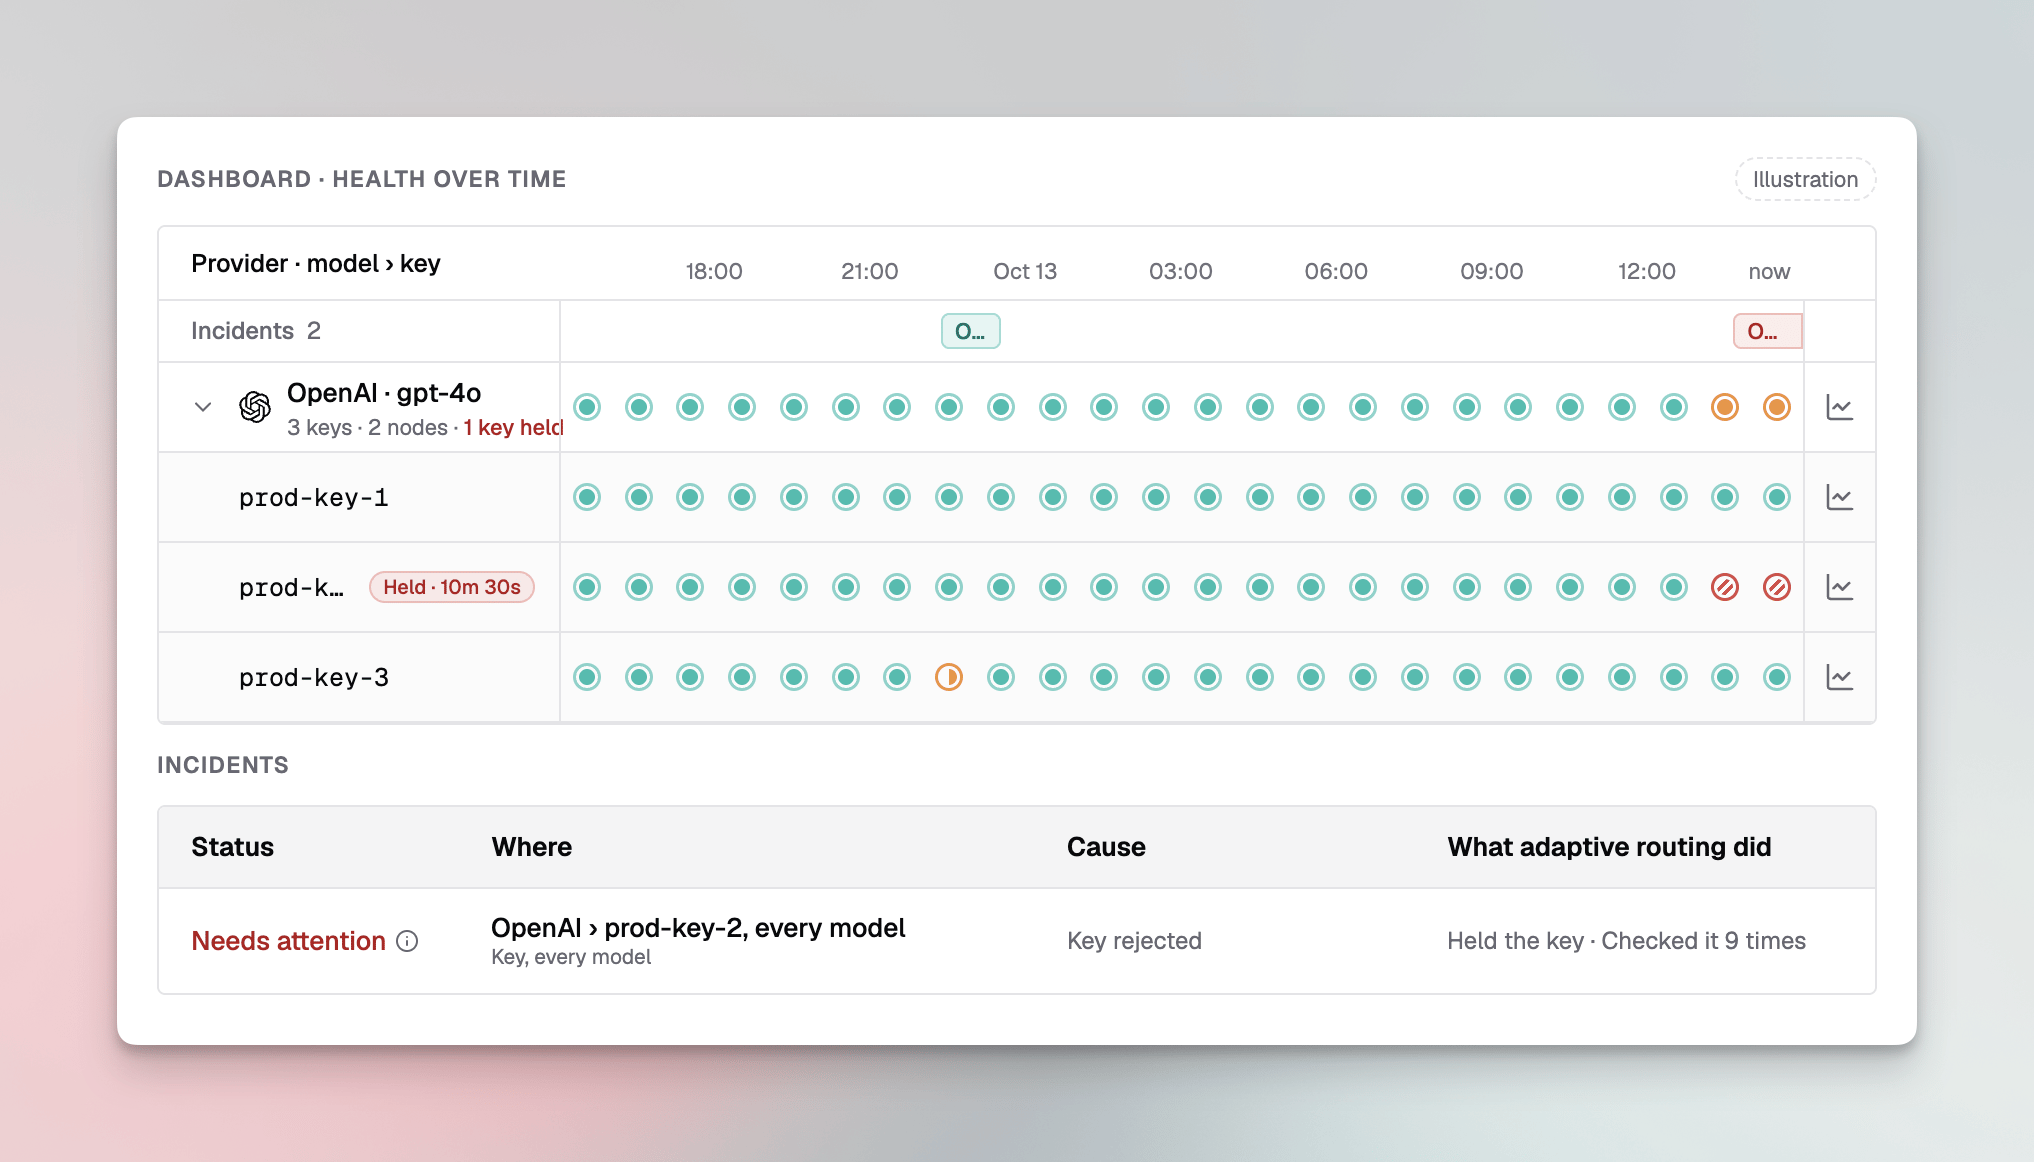
The OpenAI gpt-4o row with prod-key-2 hatched as held for the last two hours, and an incident that needs attention: key rejected, held the key and checked it 9 times
What you see: a key row turns hatched red with a Held chip, the provider row shows 1 key held, and an incident on Key, every model says Needs attention with cause Key rejected. What it means: the provider returned an authentication error for the key, for example because it was revoked or rotated outside Bifrost. The key is out of rotation on every node and gets one request after each wait. The provider’s other keys carry its traffic. What to do: replace the key in the provider’s settings. Editing the key releases the hold, and adaptive routing checks the new key with live traffic. To check the existing key at once, release it from Held keys.

Key rate limited

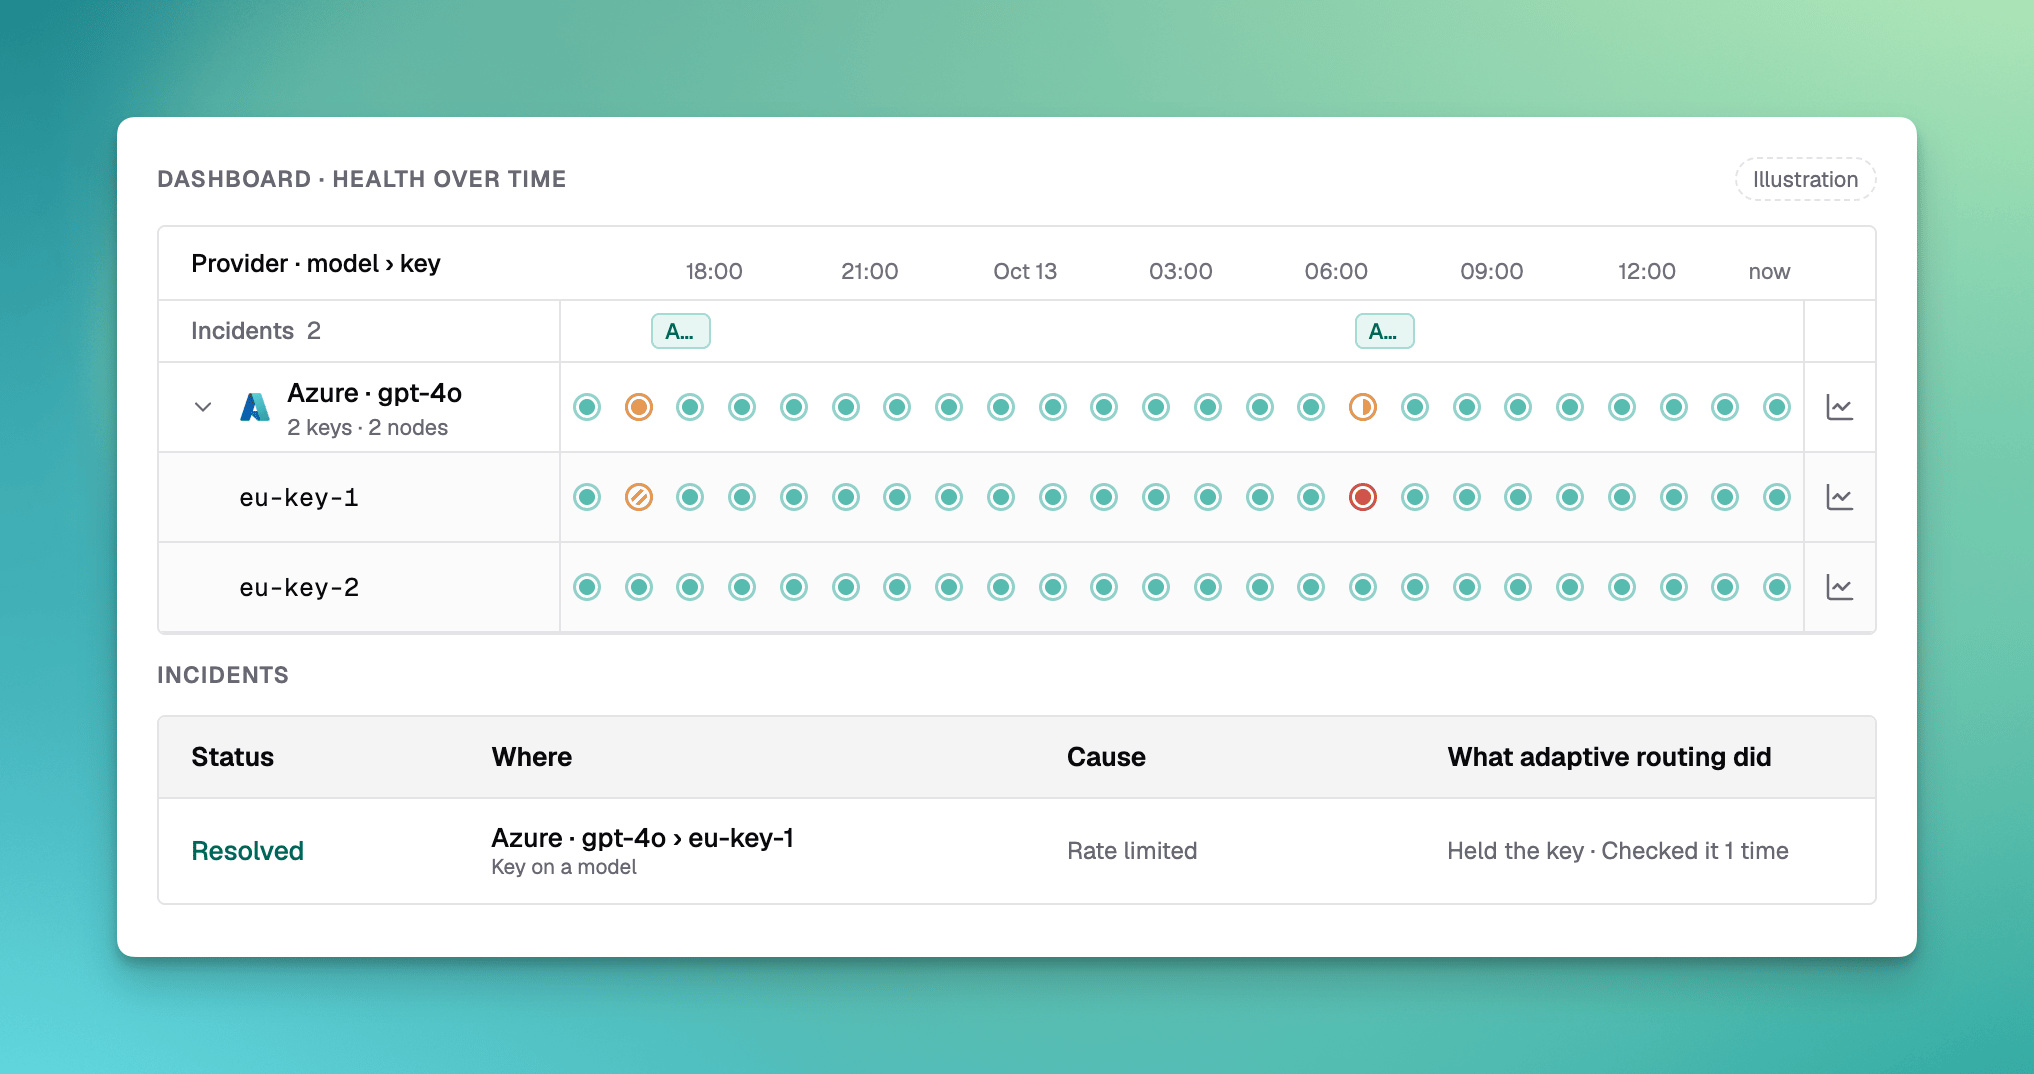
The Azure gpt-4o row with eu-key-1 briefly hatched amber, and a resolved incident: rate limited, held the key and checked it once
What you see: a short amber hatch on one key and a resolved incident with cause Rate limited. What it means: the provider rate limited the key for one model. Adaptive routing held it for as long as the provider asked (or a short wait when it did not say), sent its traffic to the other keys, and the first check after the wait served. What to do: nothing, unless it keeps happening. Frequent rate limits on one key mean it needs more capacity or another key alongside it.

Provider outage

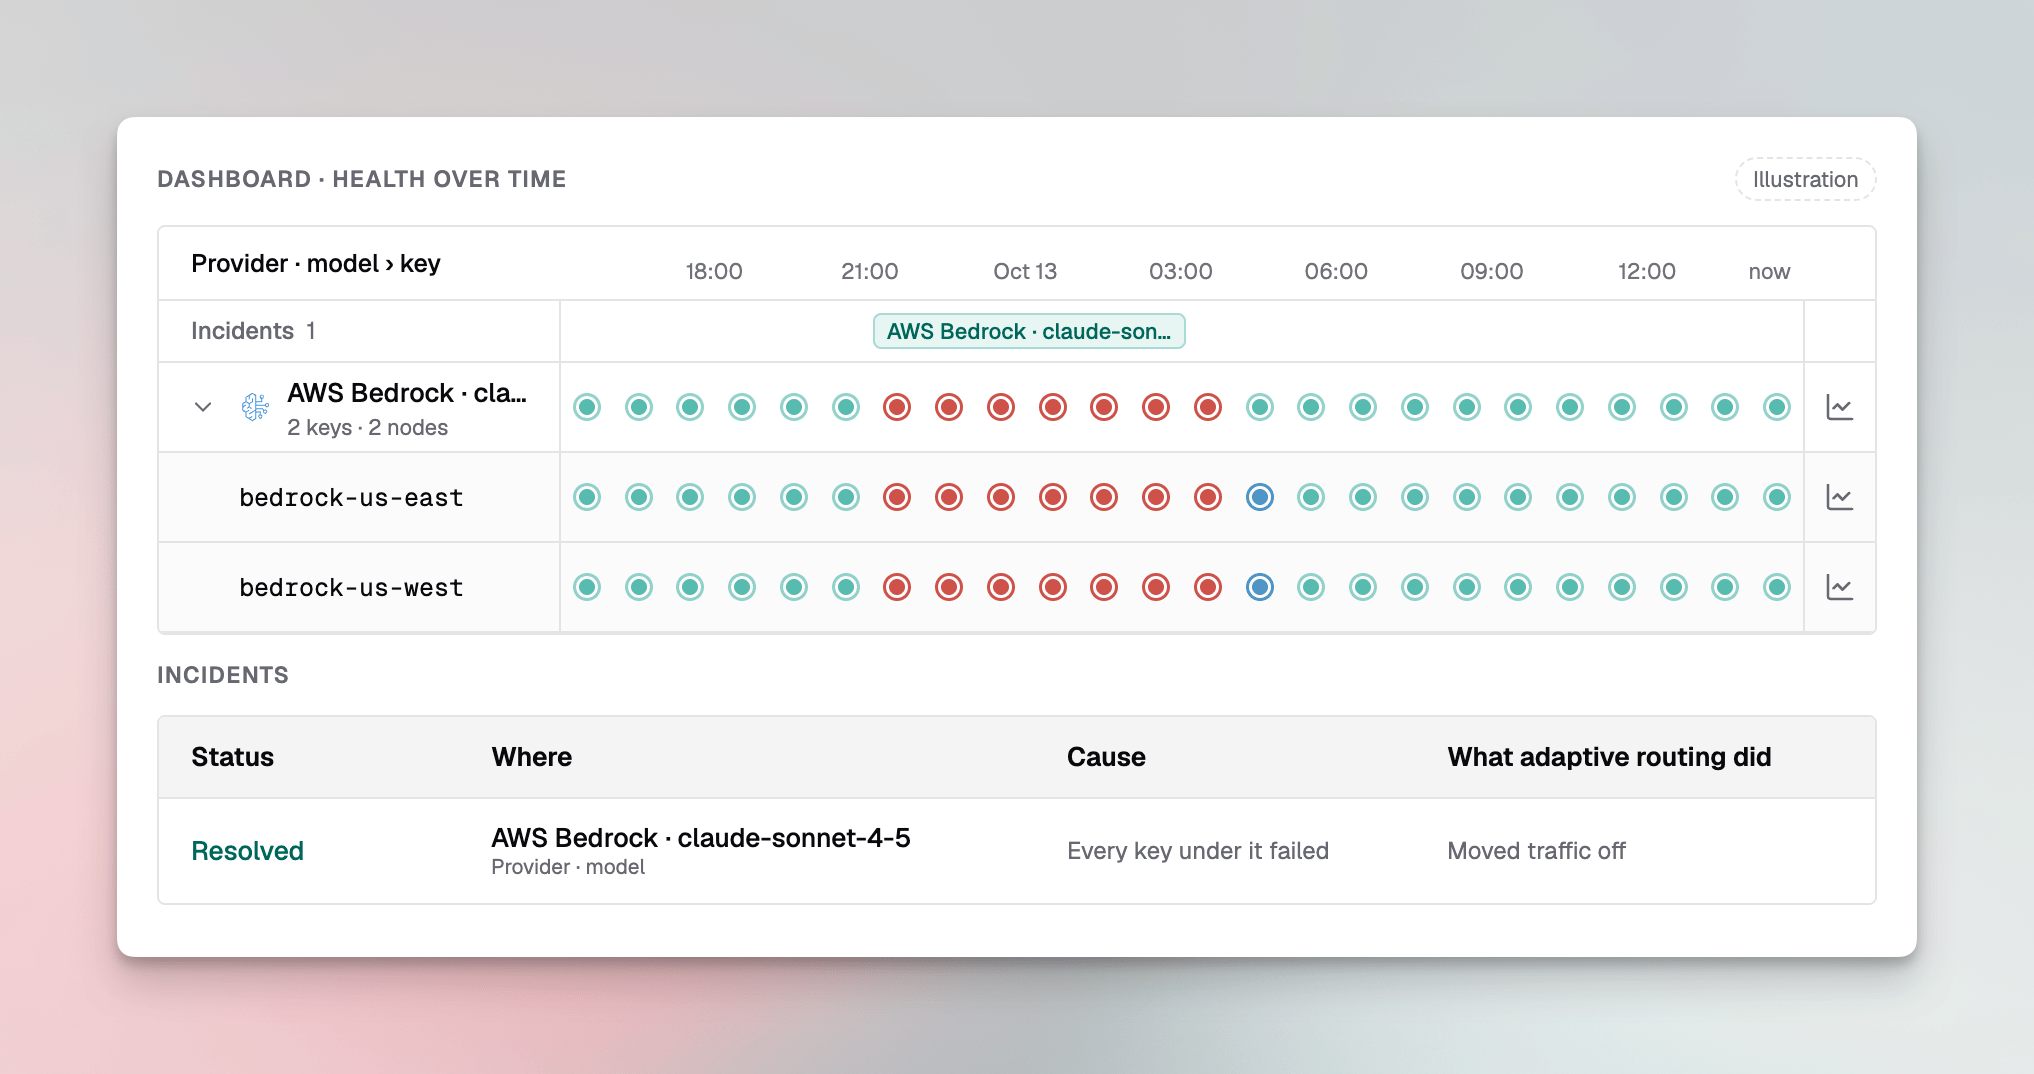
The AWS Bedrock claude-sonnet-4-5 row and both its keys Failed for six hours, the keys recovering afterwards, and a resolved incident: every key under it failed, moved traffic off
What you see: a provider row and all of its keys turn Failed together, the keys pass through Recovering when it ends, and an incident on Provider · model says Every key under it failed and Moved traffic off. What it means: the provider was down or erroring for the model. Requests that did not name a provider were sent to the other providers for the model. Requests that named it were moved only with redirecting on, and those count in Requests saved. What to do: nothing for requests adaptive routing could move. If the incident shows requests failing with nothing healthier to send them to, add another provider for the model, or a fallback to the requests or a routing rule.

Key out of quota, recovering

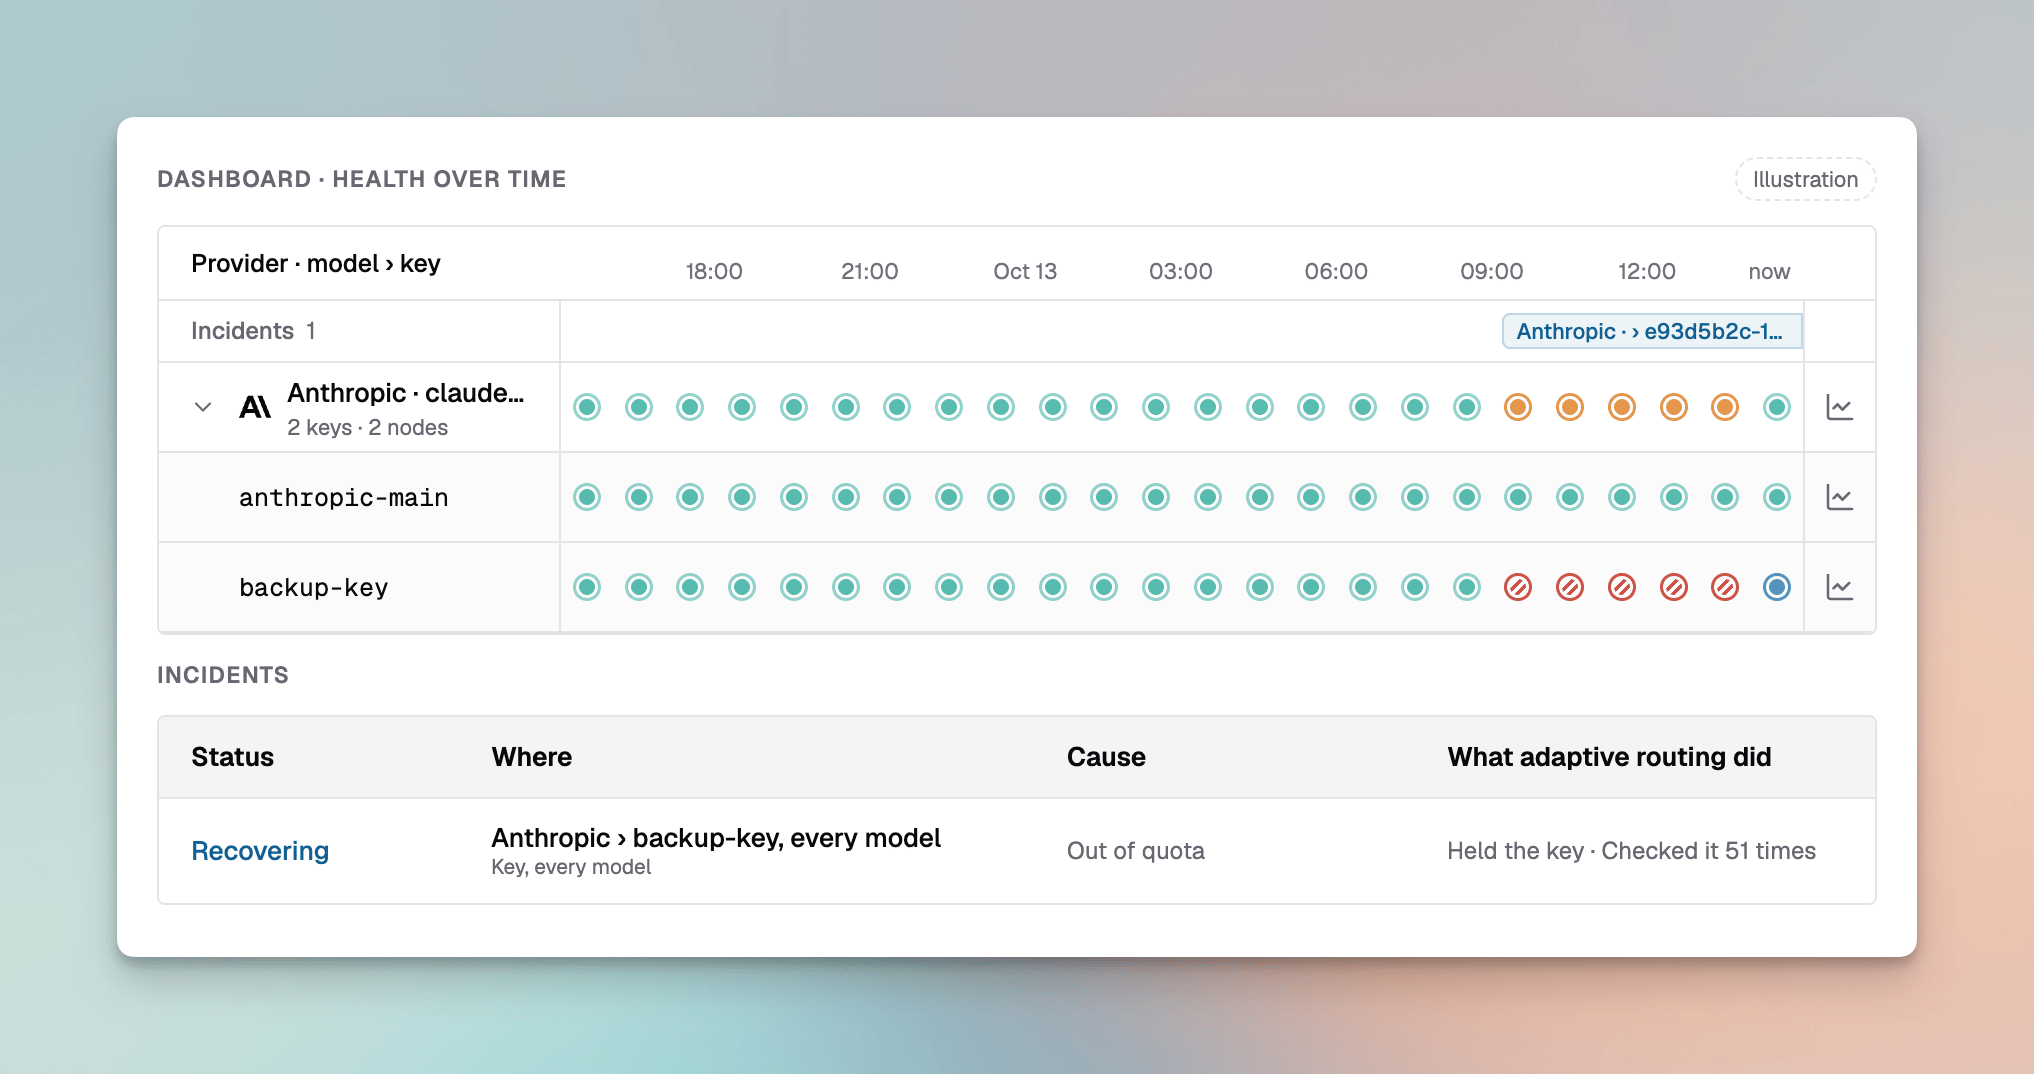
The Anthropic claude-sonnet-4-5 row degraded while backup-key was held for out of quota, the key recovering after it was edited, and a recovering incident: held the key and checked it 51 times
What you see: a key held for Out of quota keeps its provider Degraded while the provider’s other keys serve. After the quota is fixed the key shows Recovering, and the incident’s Recent changes shows the key edit. What it means: the key’s account ran out of credit, so every model on it was held. Editing the key released the hold, and the key is earning its traffic back. What to do: nothing more. The incident resolves once the key serves its share cleanly.

Requests kept on a failing provider

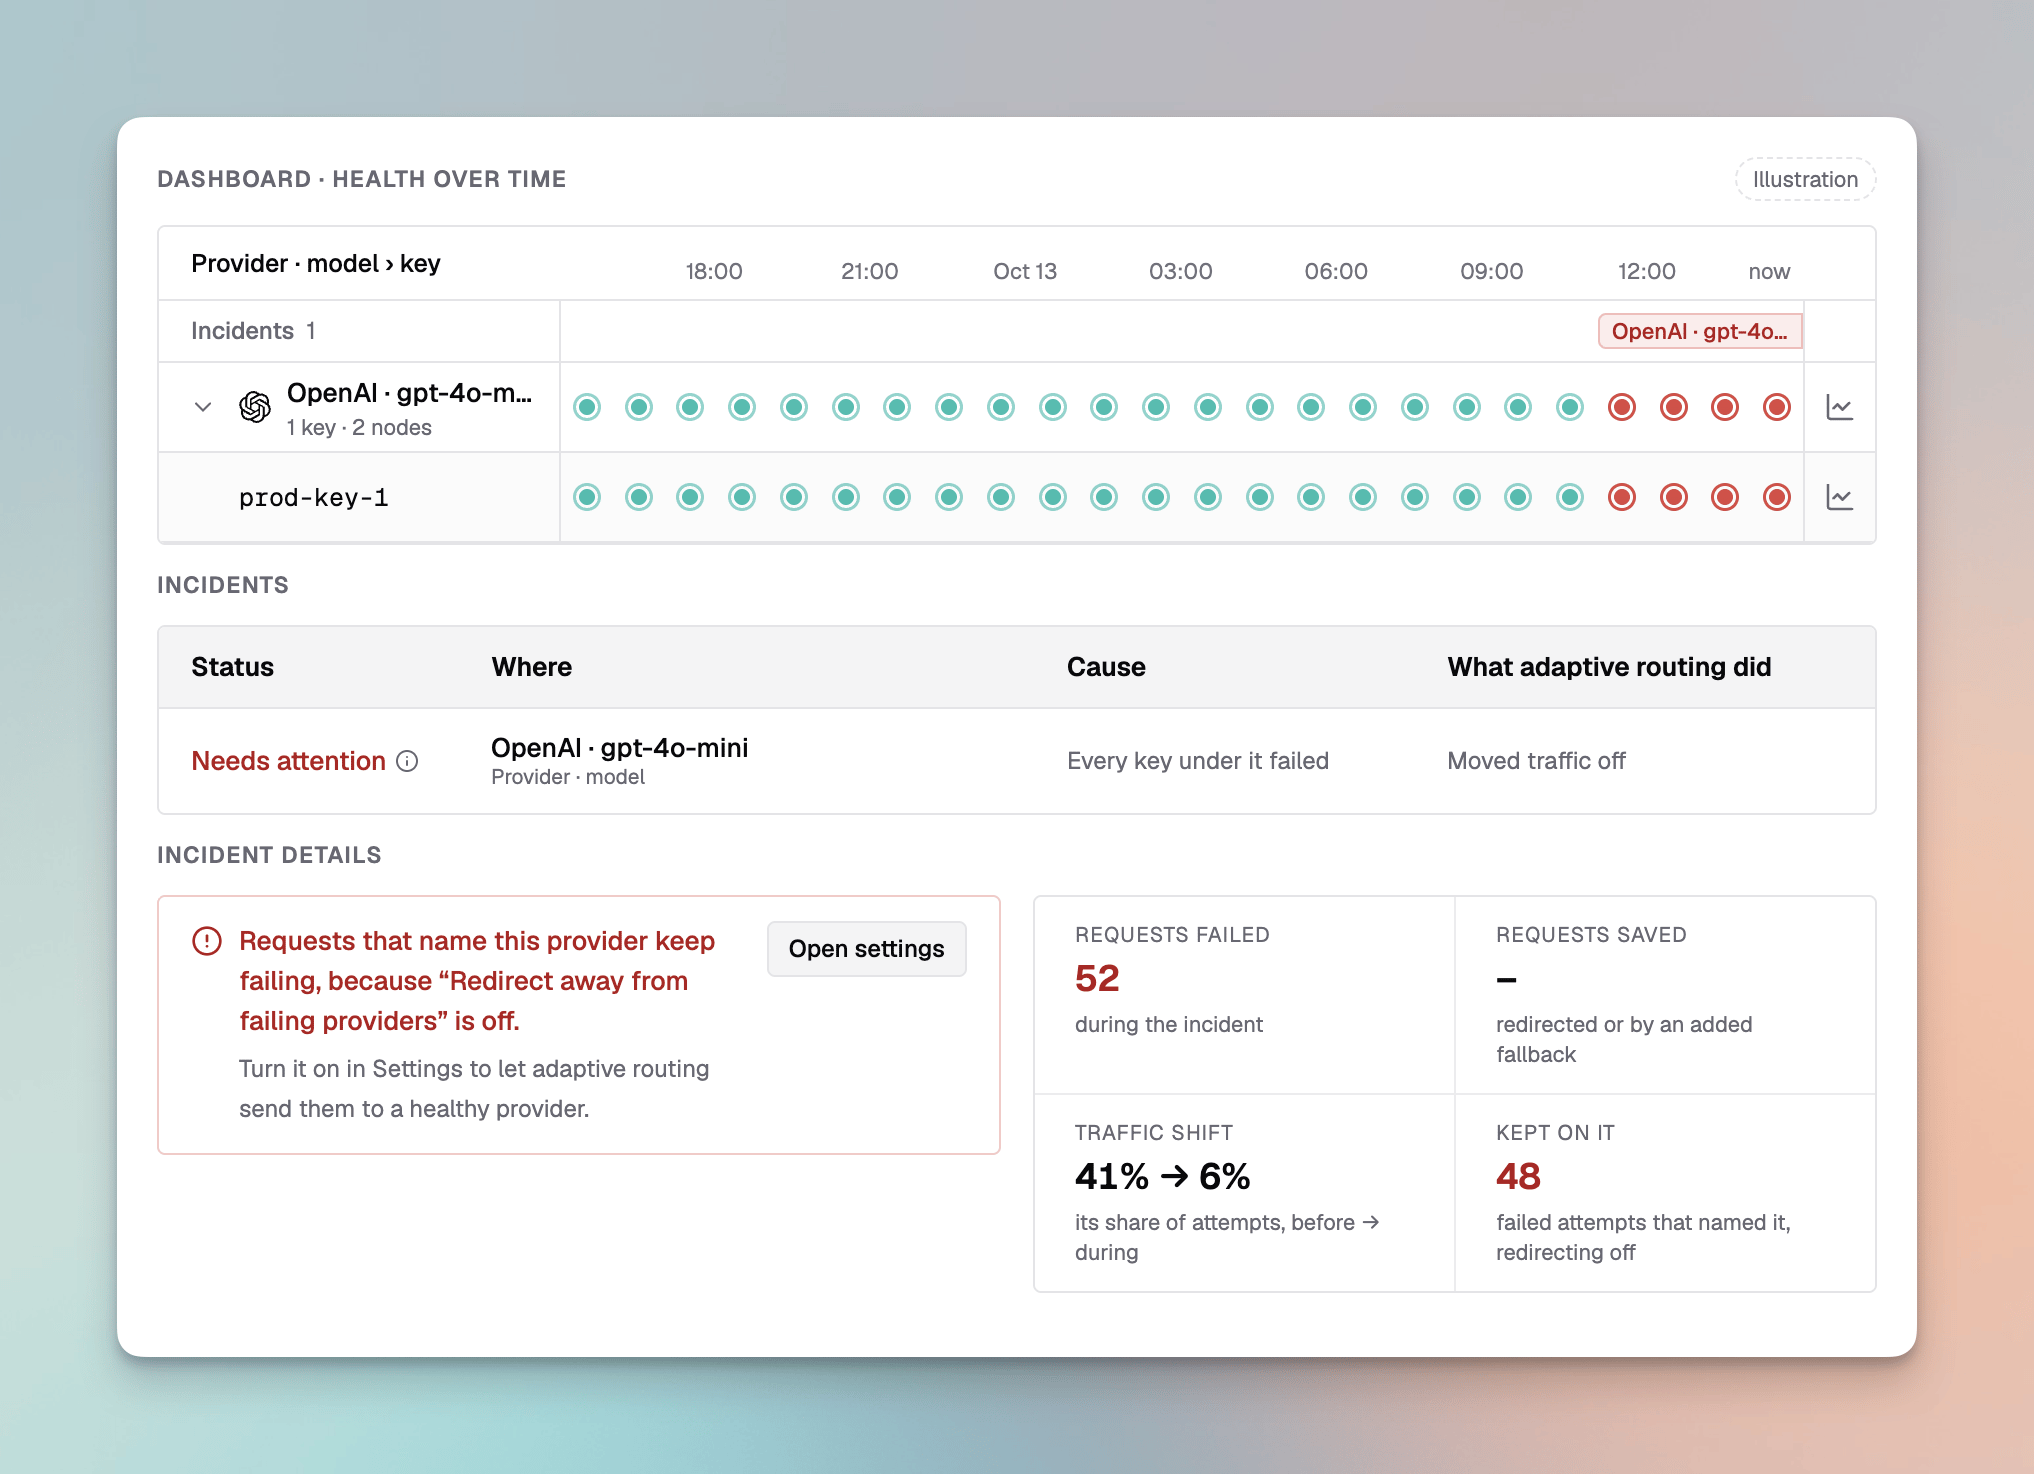
The OpenAI gpt-4o-mini row Failed for the last four hours, an incident that needs attention because requests that name the provider keep failing while redirecting is off, and the Kept on it figure
What you see: a provider is Failed, its incident Needs attention, Requests failed says how many were kept on a failing provider, and the incident counts them under Kept on it. What it means: these requests named the provider, by provider/model, a routing rule or the virtual key, and Redirect Away from Failing Providers is off, so adaptive routing left them on it. What to do: turn on Redirect Away from Failing Providers, and Add Fallbacks When a Provider Is Named if you want those requests to fall back while the provider recovers. Or give the requests fallbacks of their own.

Waiting for traffic
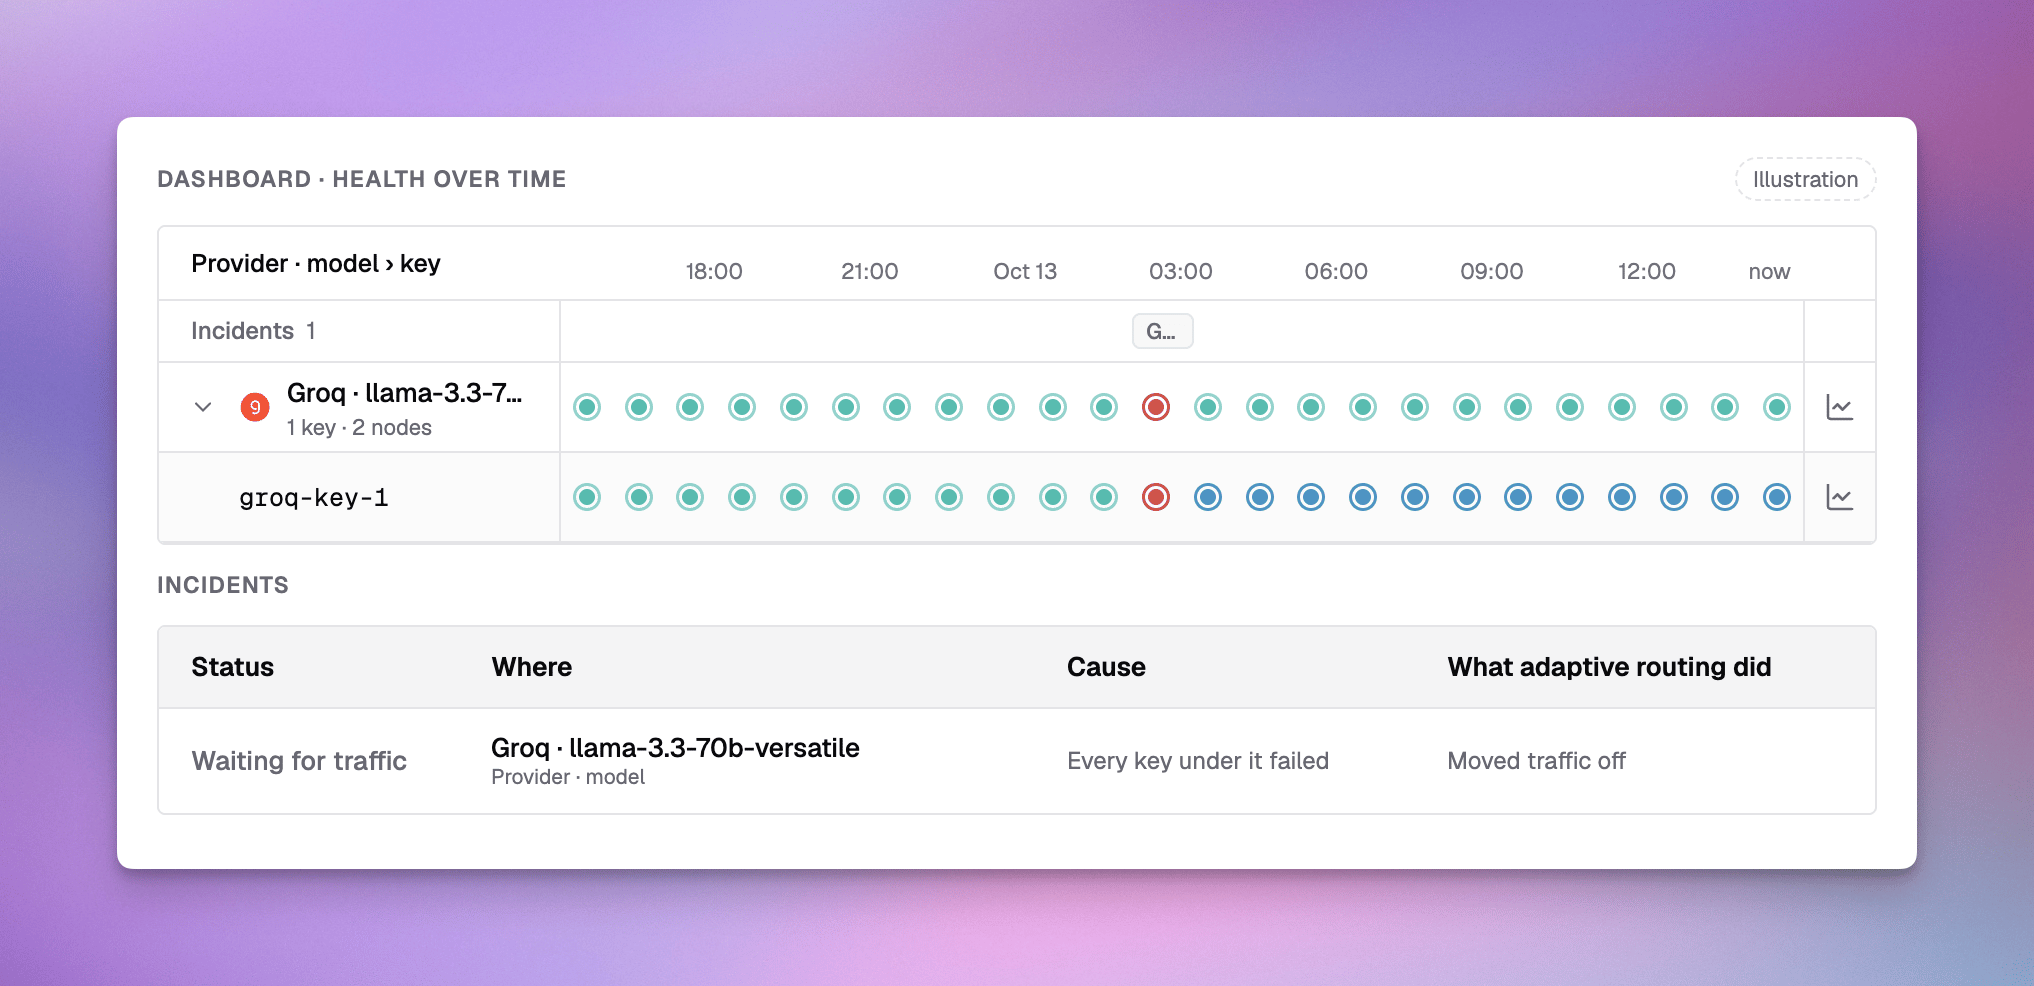
The Groq llama-3.3-70b-versatile row failed briefly, its key recovering for the rest of the day with no traffic, and an incident waiting for traffic
What you see: a key stays Recovering for hours, and its incident shows Waiting for traffic. What it means: the key came back after a failure, but no request has reached it for an hour, so adaptive routing has not seen it serve its share yet. This is common for a provider that only serves as a fallback. What to do: nothing. The next requests that reach it confirm the recovery.