> ## Documentation Index
> Fetch the complete documentation index at: https://docs.getbifrost.ai/llms.txt
> Use this file to discover all available pages before exploring further.
# Splunk
> Ship Bifrost request traces to Splunk over HTTP Event Collector (HEC) as flattened per-request events plus a derived metric set
The Splunk connector is an **Enterprise** feature. It requires a Bifrost Enterprise license.
## Overview
The **Splunk connector** forwards completed Bifrost request traces to Splunk over the [HTTP Event Collector (HEC)](https://docs.splunk.com/Documentation/Splunk/latest/Data/UsetheHTTPEventCollector). It is a hybrid connector that emits two things from the same trace:
* **Events**: one flattened event per LLM request, written to a Splunk **event index**. Each event carries the request's provider, model, status, token counts, cost, latency, attribution, and optionally the prompt/response content.
* **Metrics**: the full Bifrost metric set (requests, tokens, latency, cost, and more), written to a Splunk **metrics index** as HEC metric events.
Use the Splunk connector when Splunk is your system of record and you want LLM traffic searchable in SPL alongside the rest of your operational and security data, without standing up a separate pipeline.
**Key benefits:**
* **One connector, both signals**: searchable events for investigation and drill-down, plus metrics for dashboards and alerting.
* **Native SPL**: events land as flat, top-level fields, so `index=bifrost_llm status=error` works with no field extraction to configure.
* **Cost-aware**: Splunk is priced on ingest volume, and events include prompt/response content by default, so set `disable_content_logging: true` for a leaner metadata-only feed when you don't need the bodies.
This connector targets **Splunk Enterprise / Splunk Cloud via HEC**, not Splunk Observability Cloud. It ships flat events and metrics, and does **not** produce an APM-style trace waterfall. If you need distributed-trace spans in Splunk Observability Cloud, use the [OTel connector](/features/observability/otel) pointed at an OTLP collector instead.
***
## How it works
After each request completes, the connector builds one flattened event from the trace's final-attempt span plus trace-level attributes, and derives the metric set. Both are delivered asynchronously over HEC, so they add zero latency to the request path. Events and metrics are batched internally and flushed by size (`batch_max_bytes`) and time (`flush_interval_ms`), then gzipped and POSTed by a small worker pool.
Events go to `POST /services/collector/event`; metrics go to `POST /services/collector` as `metric`-typed HEC events. By default, delivery is fire-and-forget: if Splunk is slow or unreachable, packets are dropped rather than stalling requests. Enable [indexer acknowledgement](#indexer-acknowledgement) for confirmed, at-least-once delivery.
Splunk **event indexes** and **metrics indexes** are different index types and are not interchangeable. You need one of each: an event index for the per-request events and a metrics index for the derived metrics.
***
## Prerequisites
Before configuring the connector, set up Splunk:
1. **Enable HEC** and create a token (**Settings → Data inputs → HTTP Event Collector**). The token value is sent as `Authorization: Splunk `.
2. **Create two indexes**: an **event** index (e.g. `bifrost_llm`) and a **metrics** index (e.g. `bifrost_metrics`).
3. **Scope the token** to only these two indexes. Don't leave it unrestricted: an unscoped HEC token can write to any index in the deployment if the token leaks. Use separate tokens for other data producers.
***
## Setup
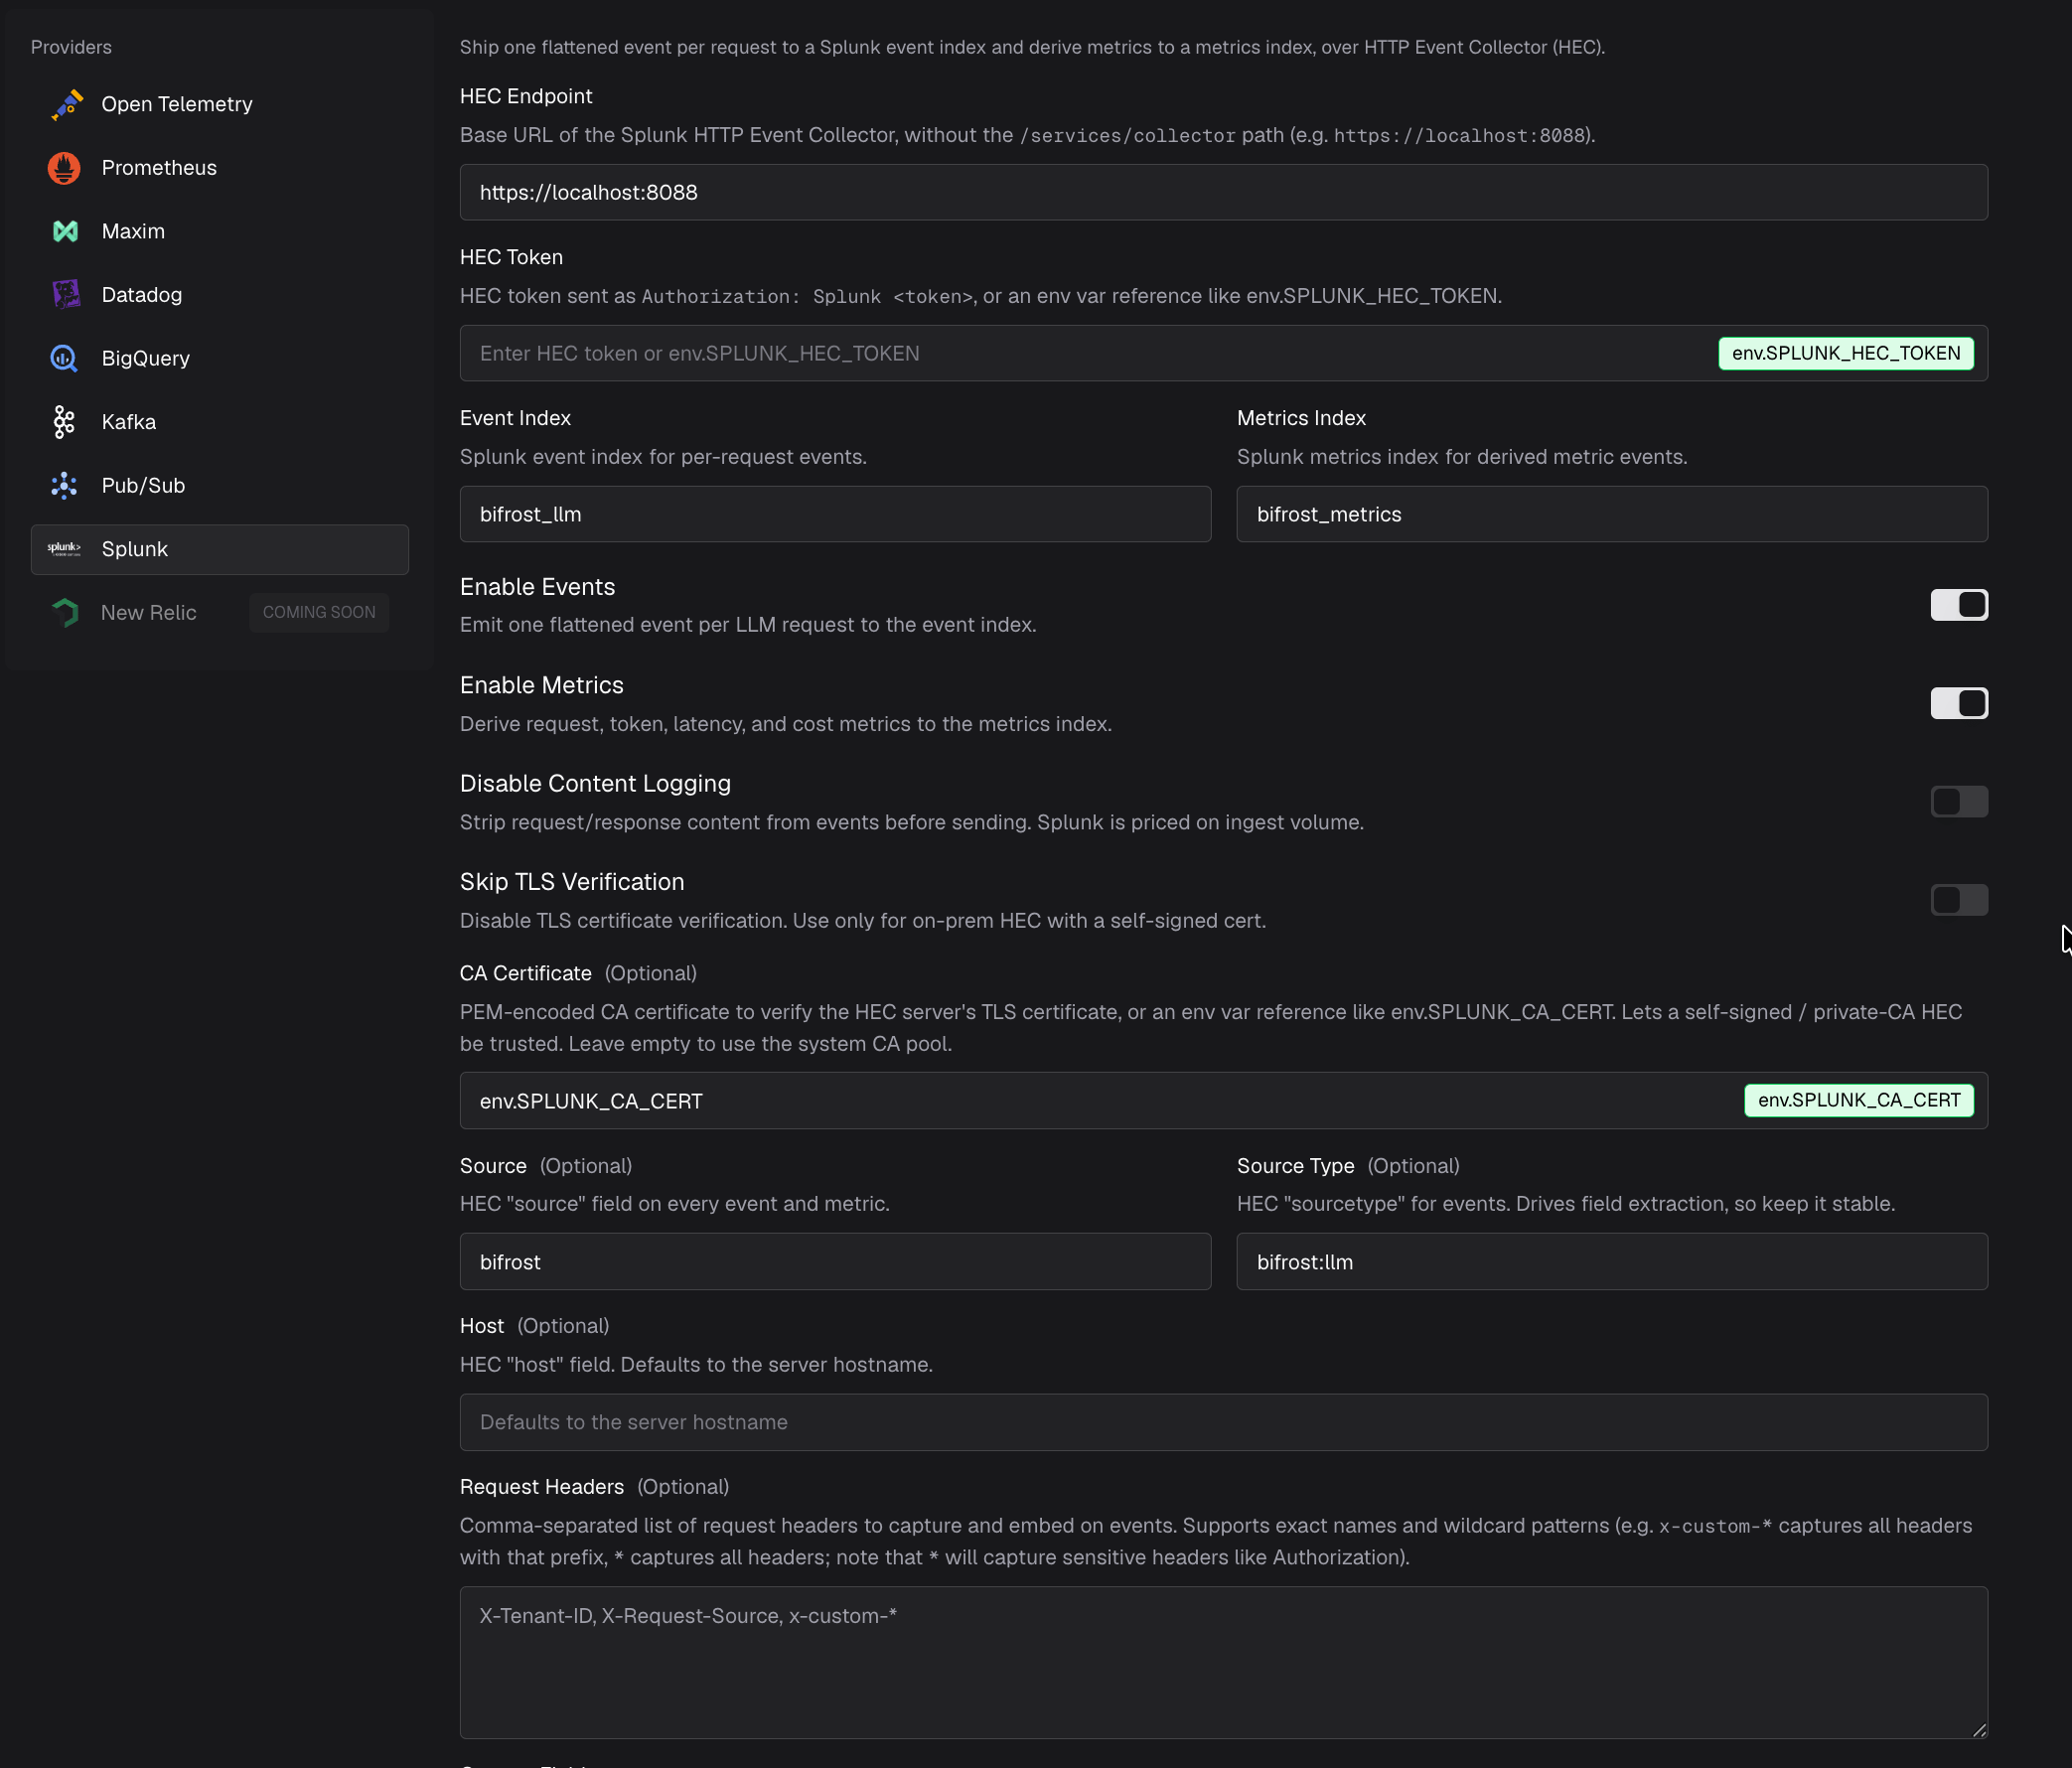
1. Navigate to **Observability** in the sidebar.
2. Select **Splunk** from the connector list.
3. Enter the **HEC Endpoint** (e.g. `https://localhost:8088`, without the `/services/collector` path) and the **HEC Token**.
4. Set the **Event Index** and, with metrics enabled, the **Metrics Index**.
5. Configure optional settings: source, sourcetype, host, TLS (CA certificate or skip-verify), request headers, and custom fields.
6. Toggle **Enabled** on, then click **Save Splunk Configuration**.
 Minimal configuration:
```json theme={null}
{
"plugins": [
{
"enabled": true,
"name": "splunk",
"config": {
"endpoint": "https://localhost:8088",
"token": "env.SPLUNK_HEC_TOKEN",
"events_index": "bifrost_llm",
"metrics_index": "bifrost_metrics"
}
}
]
}
```
Full configuration:
```json theme={null}
{
"plugins": [
{
"enabled": true,
"name": "splunk",
"config": {
"endpoint": "https://splunk.internal:8088",
"token": "env.SPLUNK_HEC_TOKEN",
"events_index": "bifrost_llm",
"metrics_index": "bifrost_metrics",
"source": "bifrost",
"sourcetype": "bifrost:llm",
"enable_events": true,
"enable_metrics": true,
"disable_content_logging": true,
"ca_cert": "env.SPLUNK_CA_CERT",
"request_headers": ["x-tenant-id", "x-request-source"],
"custom_fields": {
"environment": "production",
"region": "us-east-1"
}
}
}
]
}
```
Set the referenced environment variables:
```bash theme={null}
export SPLUNK_HEC_TOKEN="your-hec-token"
export SPLUNK_CA_CERT="$(cat /path/to/splunk-ca.pem)"
```
***
## Configuration reference
| Field | Type | Required | Default | Description |
| ------------------------- | --------------------- | ------------ | --------------- | ------------------------------------------------------------------------------------------------------------------------------------------------------------------------------------------------------------------------------------------------------------------ |
| `endpoint` | `string` | ✅ | - | HEC base URL, e.g. `https://localhost:8088`. Do not include the `/services/collector` path. |
| `token` | `string \| SecretVar` | ✅ | - | HEC token, sent as `Authorization: Splunk `. Supports `env.VAR_NAME`. |
| `events_index` | `string` | Events only | - | Splunk **event** index for per-request events. Required when `enable_events` is true. |
| `metrics_index` | `string` | Metrics only | - | Splunk **metrics** index for derived metrics. Required when `enable_metrics` is true. |
| `source` | `string` | ❌ | `bifrost` | HEC `source` field on every event and metric. |
| `sourcetype` | `string` | ❌ | `bifrost:llm` | HEC `sourcetype` for events (metrics use `bifrost:metric`). Drives field extraction, so keep it stable. |
| `host` | `string` | ❌ | server hostname | HEC `host` field. |
| `enable_events` | `boolean` | ❌ | `true` | Emit one flattened event per request to the event index. |
| `enable_metrics` | `boolean` | ❌ | `true` | Derive and emit the metric set to the metrics index. |
| `disable_content_logging` | `boolean` | ❌ | `false` | Strip request/response content from events. See [Controlling exported content](#controlling-exported-content). |
| `ca_cert` | `string \| SecretVar` | ❌ | - | PEM-encoded CA certificate to verify the HEC server's TLS cert. Omit to use the system CA pool. Supports `env.VAR_NAME`. See [TLS](#tls). |
| `insecure_skip_verify` | `boolean` | ❌ | `false` | Disable TLS certificate verification. **Development or isolated environments only**; production should trust the endpoint via `ca_cert` instead. See [TLS](#tls). |
| `custom_fields` | `object` | ❌ | - | Static key/value fields added to every event and metric. |
| `request_headers` | `string[]` | ❌ | - | Request-header name patterns to capture onto events. **Use an explicit allowlist of exact header names.** Wildcards (`x-custom-*`, `*`) are supported but can capture credentials such as `Authorization`, so use them only after reviewing every matching header. |
| `batch_max_bytes` | `integer` | ❌ | `524288` | Flush a HEC batch once its concatenated bodies reach this many bytes. |
| `flush_interval_ms` | `integer` | ❌ | `1000` | Maximum time buffered events wait before a flush. |
| `post_workers` | `integer` | ❌ | `4` | Concurrent HEC poster goroutines (capped at 64). |
| `indexer_ack` | `boolean` | ❌ | `false` | Enable HEC indexer acknowledgement for confirmed delivery. Set this when the HEC token has acknowledgement enabled. See [Indexer acknowledgement](#indexer-acknowledgement). |
| `ack_poll_interval_ms` | `integer` | ❌ | `1000` | How often to poll Splunk for acknowledgement. Only used when `indexer_ack` is true. |
| `ack_timeout_ms` | `integer` | ❌ | `30000` | How long an unacknowledged batch waits before the client resends it. Only used when `indexer_ack` is true. |
| `max_ack_attempts` | `integer` | ❌ | `3` | Maximum POST attempts per batch before it is dropped. Only used when `indexer_ack` is true. |
Events and metrics are independent. Run **metrics-only** by setting `enable_events: false` (then `events_index` is not required), or **events-only** with `enable_metrics: false` (then `metrics_index` is not required). At least one of the two must be enabled.
***
## Searching your data
Events and metrics live in different index types, so they are queried differently.
**Events**: a normal search against the event index:
```
index=bifrost_llm sourcetype="bifrost:llm" status=error
```
Each event exposes flat, top-level fields: `request_id`, `trace_id`, `provider`, `model`, `status`, `input_tokens`, `output_tokens`, `total_tokens`, `cost`, `latency_ms`, and attribution fields.
**Metrics**: use `mstats` (note the leading pipe and the `metric_name` filter, both required):
```
| mstats avg(_value) WHERE index=bifrost_metrics AND metric_name=* BY metric_name
```
To break a single metric down by dimension:
```
| mstats avg(_value) WHERE index=bifrost_metrics AND metric_name="bifrost.requests.total" BY provider, model
```
***
## TLS
HEC is served over HTTPS. The connector verifies the server certificate against the system CA pool by default. For an on-prem HEC that uses a self-signed or private-CA certificate, you have two options:
* **`ca_cert`** (recommended): supply the PEM-encoded CA certificate so the self-signed/private-CA endpoint is *trusted* while verification stays on:
```json theme={null}
{
"ca_cert": "env.SPLUNK_CA_CERT"
}
```
* **`insecure_skip_verify`** (development / isolated environments only): disable verification entirely. This encrypts the connection but does not authenticate it, leaving it open to man-in-the-middle attacks. Not for production, use `ca_cert` instead.
```json theme={null}
{
"insecure_skip_verify": true
}
```
`insecure_skip_verify` takes precedence over `ca_cert`: when it is enabled, verification is off and `ca_cert` is ignored. Prefer `ca_cert` in production, and always reference it via an environment variable (`env.SPLUNK_CA_CERT`) rather than embedding PEM text directly in `config.json` or the database.
***
## Indexer acknowledgement
By default the connector delivers over HEC fire-and-forget: once Splunk returns `200`, the batch is considered sent. If your HEC token has **indexer acknowledgement** enabled, Splunk requires every request to carry a channel and confirms data only once it is indexed to disk. Set `indexer_ack: true` to turn this on.
With acknowledgement enabled, the connector:
* Sends a per-instance channel (`X-Splunk-Request-Channel`) on every request.
* Tracks each batch's `ackId` and polls `POST /services/collector/ack` (every `ack_poll_interval_ms`) until Splunk confirms the batch was indexed.
* Resends a batch that is not acknowledged within `ack_timeout_ms`, up to `max_ack_attempts` times, then drops it.
```json theme={null}
{
"name": "splunk",
"config": {
"endpoint": "https://localhost:8088",
"token": "env.SPLUNK_HEC_TOKEN",
"events_index": "bifrost_llm",
"metrics_index": "bifrost_metrics",
"indexer_ack": true,
"ack_timeout_ms": 30000,
"max_ack_attempts": 3
}
}
```
Enable `indexer_ack` only when the HEC token actually has indexer acknowledgement turned on. An ack-enabled token **rejects** requests that lack a channel, so leaving this off against such a token drops all delivery; conversely, a non-ack token returns no `ackId`, so turning it on adds overhead with nothing to confirm.
Acknowledgement trades a little overhead (per-channel poll traffic, plus unacknowledged batches held in memory until confirmed) for delivery confirmation. Delivery stays **at-least-once**: only unacknowledged batches are resent, so duplicates are rare but possible if an acknowledgement is lost after indexing. Leave acknowledgement off unless your token requires it or you need indexing confirmation.
***
## Attribution fields
Bifrost attributes each request to a virtual key, user, team, customer, and business unit. Because a request can be attributed to a *set* (multi-tenant), the connector shapes attribution differently for events and metrics:
* **Events** carry one **multi-value** field per dimension (`team_ids`, `team_names`, `customer_ids`, `customer_names`, `business_unit_ids`, `business_unit_names`) as native JSON arrays, so `customer_ids=acme` matches a member of the set. Virtual-key and user attribution stay scalar (`virtual_key_id`, `virtual_key_name`, `user_id`, `user_name`).
* **Metrics** dimensions must be scalar (a comma-joined value would break `mstats ... BY`), so metric dimensions keep the **singular** form (`customer_id`, `team_id`, ...). Multi-tenant metric attribution reflects the primary tenant only.
The event field names (`*_ids` / `*_names`) are Splunk-specific and differ from the singular tags used by other connectors. Build your SPL against the plural, multi-value field names.
***
## Metrics reference
With `enable_metrics` on, the connector emits the following metrics to the metrics index. Metric names match the Bifrost metric contract used across connectors.
| Metric | Description | Dimensions |
| --------------------------------------- | ------------------------------- | ------------------------------------------------------------------------------ |
| `bifrost.requests.total` | Total LLM requests | provider, model, method |
| `bifrost.success.total` | Successful requests | provider, model, method |
| `bifrost.errors.total` | Failed requests | provider, model, method, reason |
| `bifrost.latency.seconds` | Request latency | provider, model, method |
| `bifrost.tokens.input` | Input/prompt tokens | provider, model |
| `bifrost.tokens.output` | Output/completion tokens | provider, model |
| `bifrost.tokens.total` | Total tokens (input + output) | provider, model |
| `bifrost.request.cost.usd` | Per-request cost in USD | provider, model |
| `bifrost.cache.hits` | Cache hits | provider, model, cache\_type |
| `bifrost.stream.first_token_latency` | Time to first token (streaming) | provider, model |
| `bifrost.stream.inter_token_latency` | Inter-token latency (streaming) | provider, model |
| `bifrost.mcp.client.operation.duration` | Duration of an MCP tool call | mcp\_method, mcp\_tool\_name, network\_transport, error\_type, and attribution |
Every metric also carries your configured `custom_fields` and the scalar attribution dimensions.
***
## Controlling exported content
By default, events include prompt and response content. Because Splunk is priced on ingest volume, set `disable_content_logging: true` to drop message content from events before they are sent:
```json theme={null}
{
"name": "splunk",
"config": {
"endpoint": "https://localhost:8088",
"disable_content_logging": true
}
}
```
Input and output messages, prompt/instructions, embedding inputs, reasoning, and tool definitions/calls/results are dropped. Metadata is still exported (model, provider, tokens, cost, latency, status, and attribution), so metrics and dashboards are unaffected.
This flag is **independent** of the global `client.disable_content_logging`, which governs the Bifrost log store only. Setting the client flag does not stop content from reaching Splunk; set `disable_content_logging` on the Splunk connector as well.
It also does **not** cover attribution identifiers, which remain on events and metrics. Values captured via `request_headers` are attached regardless of this flag, so only enable header capture for headers you intend to export. Prefer an explicit allowlist of exact header names: wildcard patterns (`*`, `x-custom-*`) can export sensitive headers such as `Authorization`.
***
## Troubleshooting
### No events in the event index
* Confirm `enable_events` is true and `events_index` names an existing **event** index.
* Check the Bifrost logs for HEC errors (bad token, disallowed index, TLS failure).
* Widen the Splunk time picker to **All time** before assuming nothing arrived.
### No metrics in the metrics index
* Confirm `enable_metrics` is true and `metrics_index` names an existing **metrics** index (not an event index).
* Metric searches need the leading pipe and a `metric_name` filter: `| mstats ... WHERE index=bifrost_metrics AND metric_name=* BY metric_name`. Without them Splunk returns an error or no results.
### TLS / certificate errors
* For a self-signed or private-CA HEC, set `ca_cert` to the PEM certificate. If verification fails with a hostname mismatch (e.g. `certificate is not valid for localhost`), the server certificate's SAN does not cover the host you are connecting to.
***
## Next steps
* **[Kafka connector](/features/observability/kafka)**: stream raw JSON traces to a Kafka topic
* **[OTel connector](/features/observability/otel)**: OpenTelemetry export, including to Splunk Observability Cloud via an OTLP collector
* **[Content logging](/features/observability/content-logging)**: how content export is controlled across connectors
Minimal configuration:
```json theme={null}
{
"plugins": [
{
"enabled": true,
"name": "splunk",
"config": {
"endpoint": "https://localhost:8088",
"token": "env.SPLUNK_HEC_TOKEN",
"events_index": "bifrost_llm",
"metrics_index": "bifrost_metrics"
}
}
]
}
```
Full configuration:
```json theme={null}
{
"plugins": [
{
"enabled": true,
"name": "splunk",
"config": {
"endpoint": "https://splunk.internal:8088",
"token": "env.SPLUNK_HEC_TOKEN",
"events_index": "bifrost_llm",
"metrics_index": "bifrost_metrics",
"source": "bifrost",
"sourcetype": "bifrost:llm",
"enable_events": true,
"enable_metrics": true,
"disable_content_logging": true,
"ca_cert": "env.SPLUNK_CA_CERT",
"request_headers": ["x-tenant-id", "x-request-source"],
"custom_fields": {
"environment": "production",
"region": "us-east-1"
}
}
}
]
}
```
Set the referenced environment variables:
```bash theme={null}
export SPLUNK_HEC_TOKEN="your-hec-token"
export SPLUNK_CA_CERT="$(cat /path/to/splunk-ca.pem)"
```
***
## Configuration reference
| Field | Type | Required | Default | Description |
| ------------------------- | --------------------- | ------------ | --------------- | ------------------------------------------------------------------------------------------------------------------------------------------------------------------------------------------------------------------------------------------------------------------ |
| `endpoint` | `string` | ✅ | - | HEC base URL, e.g. `https://localhost:8088`. Do not include the `/services/collector` path. |
| `token` | `string \| SecretVar` | ✅ | - | HEC token, sent as `Authorization: Splunk `. Supports `env.VAR_NAME`. |
| `events_index` | `string` | Events only | - | Splunk **event** index for per-request events. Required when `enable_events` is true. |
| `metrics_index` | `string` | Metrics only | - | Splunk **metrics** index for derived metrics. Required when `enable_metrics` is true. |
| `source` | `string` | ❌ | `bifrost` | HEC `source` field on every event and metric. |
| `sourcetype` | `string` | ❌ | `bifrost:llm` | HEC `sourcetype` for events (metrics use `bifrost:metric`). Drives field extraction, so keep it stable. |
| `host` | `string` | ❌ | server hostname | HEC `host` field. |
| `enable_events` | `boolean` | ❌ | `true` | Emit one flattened event per request to the event index. |
| `enable_metrics` | `boolean` | ❌ | `true` | Derive and emit the metric set to the metrics index. |
| `disable_content_logging` | `boolean` | ❌ | `false` | Strip request/response content from events. See [Controlling exported content](#controlling-exported-content). |
| `ca_cert` | `string \| SecretVar` | ❌ | - | PEM-encoded CA certificate to verify the HEC server's TLS cert. Omit to use the system CA pool. Supports `env.VAR_NAME`. See [TLS](#tls). |
| `insecure_skip_verify` | `boolean` | ❌ | `false` | Disable TLS certificate verification. **Development or isolated environments only**; production should trust the endpoint via `ca_cert` instead. See [TLS](#tls). |
| `custom_fields` | `object` | ❌ | - | Static key/value fields added to every event and metric. |
| `request_headers` | `string[]` | ❌ | - | Request-header name patterns to capture onto events. **Use an explicit allowlist of exact header names.** Wildcards (`x-custom-*`, `*`) are supported but can capture credentials such as `Authorization`, so use them only after reviewing every matching header. |
| `batch_max_bytes` | `integer` | ❌ | `524288` | Flush a HEC batch once its concatenated bodies reach this many bytes. |
| `flush_interval_ms` | `integer` | ❌ | `1000` | Maximum time buffered events wait before a flush. |
| `post_workers` | `integer` | ❌ | `4` | Concurrent HEC poster goroutines (capped at 64). |
| `indexer_ack` | `boolean` | ❌ | `false` | Enable HEC indexer acknowledgement for confirmed delivery. Set this when the HEC token has acknowledgement enabled. See [Indexer acknowledgement](#indexer-acknowledgement). |
| `ack_poll_interval_ms` | `integer` | ❌ | `1000` | How often to poll Splunk for acknowledgement. Only used when `indexer_ack` is true. |
| `ack_timeout_ms` | `integer` | ❌ | `30000` | How long an unacknowledged batch waits before the client resends it. Only used when `indexer_ack` is true. |
| `max_ack_attempts` | `integer` | ❌ | `3` | Maximum POST attempts per batch before it is dropped. Only used when `indexer_ack` is true. |
Events and metrics are independent. Run **metrics-only** by setting `enable_events: false` (then `events_index` is not required), or **events-only** with `enable_metrics: false` (then `metrics_index` is not required). At least one of the two must be enabled.
***
## Searching your data
Events and metrics live in different index types, so they are queried differently.
**Events**: a normal search against the event index:
```
index=bifrost_llm sourcetype="bifrost:llm" status=error
```
Each event exposes flat, top-level fields: `request_id`, `trace_id`, `provider`, `model`, `status`, `input_tokens`, `output_tokens`, `total_tokens`, `cost`, `latency_ms`, and attribution fields.
**Metrics**: use `mstats` (note the leading pipe and the `metric_name` filter, both required):
```
| mstats avg(_value) WHERE index=bifrost_metrics AND metric_name=* BY metric_name
```
To break a single metric down by dimension:
```
| mstats avg(_value) WHERE index=bifrost_metrics AND metric_name="bifrost.requests.total" BY provider, model
```
***
## TLS
HEC is served over HTTPS. The connector verifies the server certificate against the system CA pool by default. For an on-prem HEC that uses a self-signed or private-CA certificate, you have two options:
* **`ca_cert`** (recommended): supply the PEM-encoded CA certificate so the self-signed/private-CA endpoint is *trusted* while verification stays on:
```json theme={null}
{
"ca_cert": "env.SPLUNK_CA_CERT"
}
```
* **`insecure_skip_verify`** (development / isolated environments only): disable verification entirely. This encrypts the connection but does not authenticate it, leaving it open to man-in-the-middle attacks. Not for production, use `ca_cert` instead.
```json theme={null}
{
"insecure_skip_verify": true
}
```
`insecure_skip_verify` takes precedence over `ca_cert`: when it is enabled, verification is off and `ca_cert` is ignored. Prefer `ca_cert` in production, and always reference it via an environment variable (`env.SPLUNK_CA_CERT`) rather than embedding PEM text directly in `config.json` or the database.
***
## Indexer acknowledgement
By default the connector delivers over HEC fire-and-forget: once Splunk returns `200`, the batch is considered sent. If your HEC token has **indexer acknowledgement** enabled, Splunk requires every request to carry a channel and confirms data only once it is indexed to disk. Set `indexer_ack: true` to turn this on.
With acknowledgement enabled, the connector:
* Sends a per-instance channel (`X-Splunk-Request-Channel`) on every request.
* Tracks each batch's `ackId` and polls `POST /services/collector/ack` (every `ack_poll_interval_ms`) until Splunk confirms the batch was indexed.
* Resends a batch that is not acknowledged within `ack_timeout_ms`, up to `max_ack_attempts` times, then drops it.
```json theme={null}
{
"name": "splunk",
"config": {
"endpoint": "https://localhost:8088",
"token": "env.SPLUNK_HEC_TOKEN",
"events_index": "bifrost_llm",
"metrics_index": "bifrost_metrics",
"indexer_ack": true,
"ack_timeout_ms": 30000,
"max_ack_attempts": 3
}
}
```
Enable `indexer_ack` only when the HEC token actually has indexer acknowledgement turned on. An ack-enabled token **rejects** requests that lack a channel, so leaving this off against such a token drops all delivery; conversely, a non-ack token returns no `ackId`, so turning it on adds overhead with nothing to confirm.
Acknowledgement trades a little overhead (per-channel poll traffic, plus unacknowledged batches held in memory until confirmed) for delivery confirmation. Delivery stays **at-least-once**: only unacknowledged batches are resent, so duplicates are rare but possible if an acknowledgement is lost after indexing. Leave acknowledgement off unless your token requires it or you need indexing confirmation.
***
## Attribution fields
Bifrost attributes each request to a virtual key, user, team, customer, and business unit. Because a request can be attributed to a *set* (multi-tenant), the connector shapes attribution differently for events and metrics:
* **Events** carry one **multi-value** field per dimension (`team_ids`, `team_names`, `customer_ids`, `customer_names`, `business_unit_ids`, `business_unit_names`) as native JSON arrays, so `customer_ids=acme` matches a member of the set. Virtual-key and user attribution stay scalar (`virtual_key_id`, `virtual_key_name`, `user_id`, `user_name`).
* **Metrics** dimensions must be scalar (a comma-joined value would break `mstats ... BY`), so metric dimensions keep the **singular** form (`customer_id`, `team_id`, ...). Multi-tenant metric attribution reflects the primary tenant only.
The event field names (`*_ids` / `*_names`) are Splunk-specific and differ from the singular tags used by other connectors. Build your SPL against the plural, multi-value field names.
***
## Metrics reference
With `enable_metrics` on, the connector emits the following metrics to the metrics index. Metric names match the Bifrost metric contract used across connectors.
| Metric | Description | Dimensions |
| --------------------------------------- | ------------------------------- | ------------------------------------------------------------------------------ |
| `bifrost.requests.total` | Total LLM requests | provider, model, method |
| `bifrost.success.total` | Successful requests | provider, model, method |
| `bifrost.errors.total` | Failed requests | provider, model, method, reason |
| `bifrost.latency.seconds` | Request latency | provider, model, method |
| `bifrost.tokens.input` | Input/prompt tokens | provider, model |
| `bifrost.tokens.output` | Output/completion tokens | provider, model |
| `bifrost.tokens.total` | Total tokens (input + output) | provider, model |
| `bifrost.request.cost.usd` | Per-request cost in USD | provider, model |
| `bifrost.cache.hits` | Cache hits | provider, model, cache\_type |
| `bifrost.stream.first_token_latency` | Time to first token (streaming) | provider, model |
| `bifrost.stream.inter_token_latency` | Inter-token latency (streaming) | provider, model |
| `bifrost.mcp.client.operation.duration` | Duration of an MCP tool call | mcp\_method, mcp\_tool\_name, network\_transport, error\_type, and attribution |
Every metric also carries your configured `custom_fields` and the scalar attribution dimensions.
***
## Controlling exported content
By default, events include prompt and response content. Because Splunk is priced on ingest volume, set `disable_content_logging: true` to drop message content from events before they are sent:
```json theme={null}
{
"name": "splunk",
"config": {
"endpoint": "https://localhost:8088",
"disable_content_logging": true
}
}
```
Input and output messages, prompt/instructions, embedding inputs, reasoning, and tool definitions/calls/results are dropped. Metadata is still exported (model, provider, tokens, cost, latency, status, and attribution), so metrics and dashboards are unaffected.
This flag is **independent** of the global `client.disable_content_logging`, which governs the Bifrost log store only. Setting the client flag does not stop content from reaching Splunk; set `disable_content_logging` on the Splunk connector as well.
It also does **not** cover attribution identifiers, which remain on events and metrics. Values captured via `request_headers` are attached regardless of this flag, so only enable header capture for headers you intend to export. Prefer an explicit allowlist of exact header names: wildcard patterns (`*`, `x-custom-*`) can export sensitive headers such as `Authorization`.
***
## Troubleshooting
### No events in the event index
* Confirm `enable_events` is true and `events_index` names an existing **event** index.
* Check the Bifrost logs for HEC errors (bad token, disallowed index, TLS failure).
* Widen the Splunk time picker to **All time** before assuming nothing arrived.
### No metrics in the metrics index
* Confirm `enable_metrics` is true and `metrics_index` names an existing **metrics** index (not an event index).
* Metric searches need the leading pipe and a `metric_name` filter: `| mstats ... WHERE index=bifrost_metrics AND metric_name=* BY metric_name`. Without them Splunk returns an error or no results.
### TLS / certificate errors
* For a self-signed or private-CA HEC, set `ca_cert` to the PEM certificate. If verification fails with a hostname mismatch (e.g. `certificate is not valid for localhost`), the server certificate's SAN does not cover the host you are connecting to.
***
## Next steps
* **[Kafka connector](/features/observability/kafka)**: stream raw JSON traces to a Kafka topic
* **[OTel connector](/features/observability/otel)**: OpenTelemetry export, including to Splunk Observability Cloud via an OTLP collector
* **[Content logging](/features/observability/content-logging)**: how content export is controlled across connectors