> ## Documentation Index
> Fetch the complete documentation index at: https://docs.getbifrost.ai/llms.txt
> Use this file to discover all available pages before exploring further.
# OpenTelemetry (OTel)
> Integrate with OpenTelemetry collectors for enterprise observability and distributed tracing
## Overview
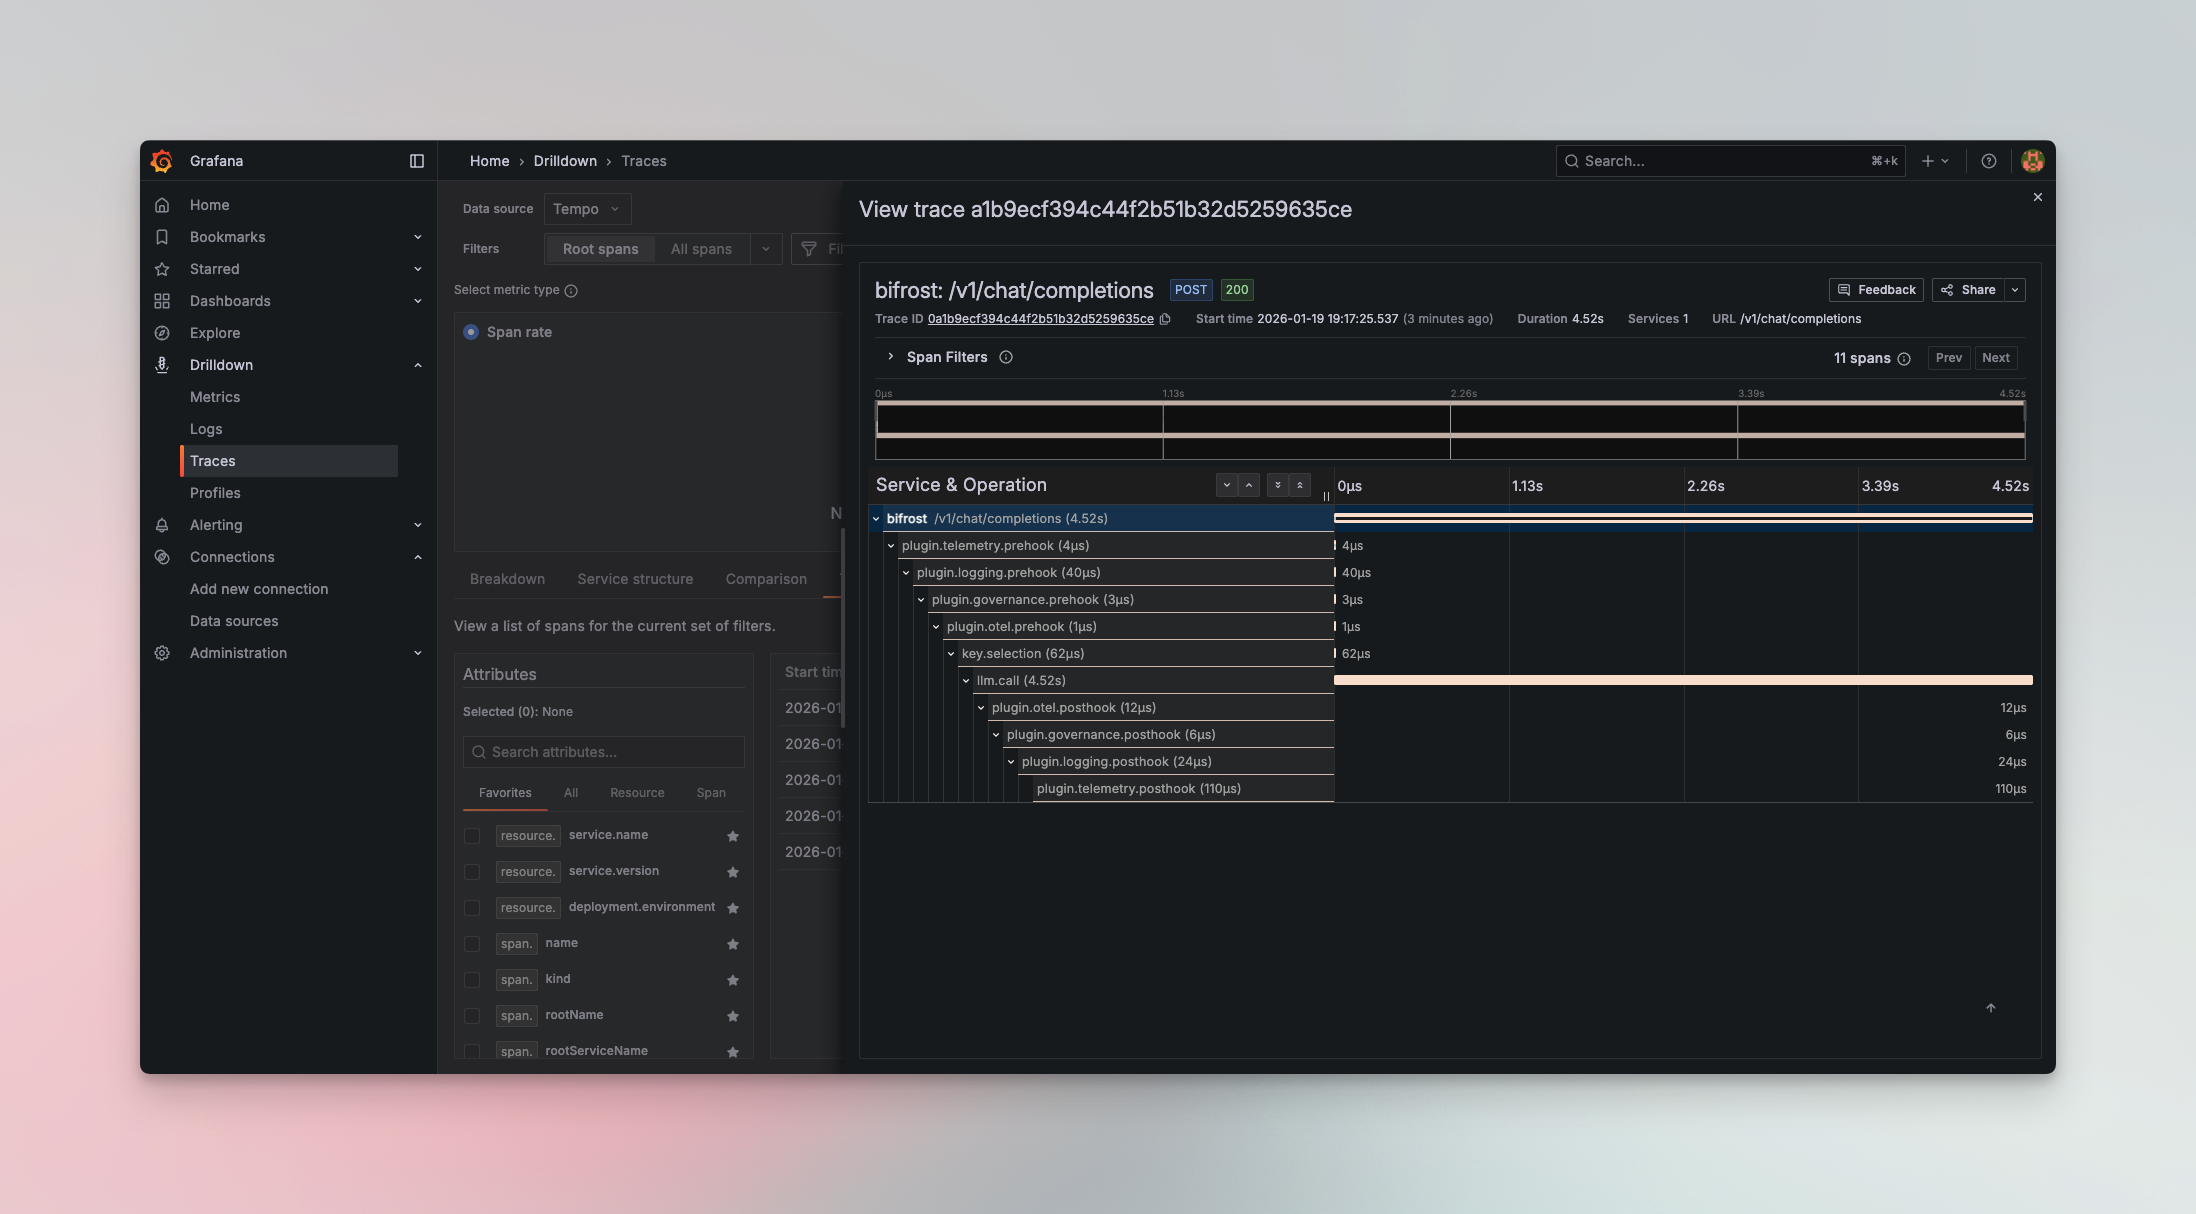 The **OTel plugin** enables seamless integration with OpenTelemetry Protocol (OTLP) collectors, allowing you to send LLM traces to your existing observability infrastructure. Connect Bifrost to platforms like Grafana Cloud, Datadog, New Relic, Honeycomb, or self-hosted collectors.
All traces follow OpenTelemetry semantic conventions, making it easy to correlate LLM operations with your broader application telemetry.
***
## Supported Trace Formats
The plugin supports multiple trace formats to match your observability platform:
| Format | Description | Use Case | Status |
| ----------------- | ---------------------------------------- | ------------------------------------------------------------- | -------------- |
| `genai_extension` | OpenTelemetry GenAI semantic conventions | **Recommended** - Standard OTel format with rich LLM metadata | ✅ Released |
| `vercel` | Vercel AI SDK format | For Vercel AI SDK compatibility | 🔄 Coming soon |
| `open_inference` | Arize OpenInference format | For Arize Phoenix and OpenInference tools | 🔄 Coming soon |
***
## Configuration
### Required Fields
| Field | Type | Required | Description |
| --------------------------- | ------------------ | -------- | --------------------------------------------------------------------------------------------------------------------------------------------------------------------------------------------------------------------------------------- |
| `service_name` | `string` | ❌ No | Service name to be used for tracing, defaults to `bifrost` |
| `collector_url` | `string \| EnvVar` | ✅ Yes | OTLP collector endpoint URL — supports `env.VAR_NAME` |
| `trace_type` | `string` | ✅ Yes | One of: `genai_extension`, `vercel`, `open_inference` |
| `protocol` | `string` | ✅ Yes | Transport protocol: `http` or `grpc` |
| `headers` | `object` | ❌ No | Custom headers for authentication — values support `env.VAR_NAME` |
| `tls_ca_cert` | `string` | ❌ No | File path to client CA certificate for TLS. Optional. Works with both gRPC and HTTP protocol |
| `group_traces_by_session` | `boolean` | ❌ No | Group requests sharing the same `x-bf-session-id` into one trace (default: `false`). See [Grouping Traces by Session](#grouping-traces-by-session) |
| `disable_content_logging` | `boolean` | ❌ No | Drop message content from exported spans (default: `false`). See [Controlling Exported Content](#controlling-exported-content) |
| `disable_root_span_content` | `boolean` | ❌ No | Drop content from the **root span only**, keeping it on child spans (default: `false`). Overridden by `disable_content_logging`, which drops content from every span. See [Controlling Exported Content](#controlling-exported-content) |
| `request_headers` | `string[]` | ❌ No | Request-header name patterns whose values are attached to the root span as `http.request.header.*` attributes. Supports exact names and wildcards (`x-custom-*`, `*`) |
### Environment Variable Substitution
`collector_url`, `metrics_endpoint`, and individual header values all support the `env.` prefix to read from environment variables at runtime. This keeps sensitive URLs and credentials out of stored configuration.
```json theme={null}
{
"collector_url": "env.OTEL_COLLECTOR_URL",
"headers": {
"Authorization": "env.OTEL_API_KEY",
"X-Custom-Header": "env.CUSTOM_VALUE"
}
}
```
### Resource Attributes
The plugin supports the standard `OTEL_RESOURCE_ATTRIBUTES` environment variable. Any attributes defined in this variable will be automatically attached to every span emitted by the plugin.
```bash theme={null}
export OTEL_RESOURCE_ATTRIBUTES="deployment.environment=production,service.version=1.2.3,team.name=platform"
```
These attributes appear as resource-level metadata on all traces:
```json theme={null}
{
"resource": {
"attributes": {
"service.name": "bifrost",
"deployment.environment": "production",
"service.version": "1.2.3",
"team.name": "platform"
}
}
}
```
This is useful for:
* **Environment identification** - Distinguish between production, staging, and development traces
* **Service versioning** - Track which version of your service generated the trace
* **Team attribution** - Tag traces with team ownership for filtering and alerting
* **Custom metadata** - Add any key-value pairs relevant to your observability needs
### Session Tracking
Whenever a request carries the [`x-bf-session-id`](/providers/request-options) header, Bifrost tags the trace's root span with the OTEL-conventional `session.id` attribute. This happens **regardless** of the `group_traces_by_session` setting, so you can always filter and correlate traces by session in your backend even when each request remains its own trace.
### Grouping Traces by Session
By default, each request Bifrost handles becomes its own OTEL trace (still tagged with `session.id` as described above). Enable `group_traces_by_session` to instead group every request that carries the same `x-bf-session-id` header into a **single trace**, with each request's root span appearing as a top-level sibling under that trace. This is useful for viewing a multi-turn conversation or agent run as one trace in your backend.
```json theme={null}
{
"group_traces_by_session": true
}
```
When enabled, requests sharing a session ID adopt a deterministic trace ID derived from that session ID, so they land in the same trace regardless of which Bifrost node handled them.
An inbound [W3C `traceparent`](https://www.w3.org/TR/trace-context/) always takes precedence: a request that arrives on a distributed trace stays on that trace and is **not** regrouped by session. Session grouping only applies to requests that have a session ID but no incoming trace context.
Because all requests in a session share one trace, very long-lived sessions produce large traces. Use a session scope that matches how you want to view activity in your backend.
To send a session ID, pass the [`x-bf-session-id`](/providers/request-options) header on each request you want grouped together.
***
## Setup
The **OTel plugin** enables seamless integration with OpenTelemetry Protocol (OTLP) collectors, allowing you to send LLM traces to your existing observability infrastructure. Connect Bifrost to platforms like Grafana Cloud, Datadog, New Relic, Honeycomb, or self-hosted collectors.
All traces follow OpenTelemetry semantic conventions, making it easy to correlate LLM operations with your broader application telemetry.
***
## Supported Trace Formats
The plugin supports multiple trace formats to match your observability platform:
| Format | Description | Use Case | Status |
| ----------------- | ---------------------------------------- | ------------------------------------------------------------- | -------------- |
| `genai_extension` | OpenTelemetry GenAI semantic conventions | **Recommended** - Standard OTel format with rich LLM metadata | ✅ Released |
| `vercel` | Vercel AI SDK format | For Vercel AI SDK compatibility | 🔄 Coming soon |
| `open_inference` | Arize OpenInference format | For Arize Phoenix and OpenInference tools | 🔄 Coming soon |
***
## Configuration
### Required Fields
| Field | Type | Required | Description |
| --------------------------- | ------------------ | -------- | --------------------------------------------------------------------------------------------------------------------------------------------------------------------------------------------------------------------------------------- |
| `service_name` | `string` | ❌ No | Service name to be used for tracing, defaults to `bifrost` |
| `collector_url` | `string \| EnvVar` | ✅ Yes | OTLP collector endpoint URL — supports `env.VAR_NAME` |
| `trace_type` | `string` | ✅ Yes | One of: `genai_extension`, `vercel`, `open_inference` |
| `protocol` | `string` | ✅ Yes | Transport protocol: `http` or `grpc` |
| `headers` | `object` | ❌ No | Custom headers for authentication — values support `env.VAR_NAME` |
| `tls_ca_cert` | `string` | ❌ No | File path to client CA certificate for TLS. Optional. Works with both gRPC and HTTP protocol |
| `group_traces_by_session` | `boolean` | ❌ No | Group requests sharing the same `x-bf-session-id` into one trace (default: `false`). See [Grouping Traces by Session](#grouping-traces-by-session) |
| `disable_content_logging` | `boolean` | ❌ No | Drop message content from exported spans (default: `false`). See [Controlling Exported Content](#controlling-exported-content) |
| `disable_root_span_content` | `boolean` | ❌ No | Drop content from the **root span only**, keeping it on child spans (default: `false`). Overridden by `disable_content_logging`, which drops content from every span. See [Controlling Exported Content](#controlling-exported-content) |
| `request_headers` | `string[]` | ❌ No | Request-header name patterns whose values are attached to the root span as `http.request.header.*` attributes. Supports exact names and wildcards (`x-custom-*`, `*`) |
### Environment Variable Substitution
`collector_url`, `metrics_endpoint`, and individual header values all support the `env.` prefix to read from environment variables at runtime. This keeps sensitive URLs and credentials out of stored configuration.
```json theme={null}
{
"collector_url": "env.OTEL_COLLECTOR_URL",
"headers": {
"Authorization": "env.OTEL_API_KEY",
"X-Custom-Header": "env.CUSTOM_VALUE"
}
}
```
### Resource Attributes
The plugin supports the standard `OTEL_RESOURCE_ATTRIBUTES` environment variable. Any attributes defined in this variable will be automatically attached to every span emitted by the plugin.
```bash theme={null}
export OTEL_RESOURCE_ATTRIBUTES="deployment.environment=production,service.version=1.2.3,team.name=platform"
```
These attributes appear as resource-level metadata on all traces:
```json theme={null}
{
"resource": {
"attributes": {
"service.name": "bifrost",
"deployment.environment": "production",
"service.version": "1.2.3",
"team.name": "platform"
}
}
}
```
This is useful for:
* **Environment identification** - Distinguish between production, staging, and development traces
* **Service versioning** - Track which version of your service generated the trace
* **Team attribution** - Tag traces with team ownership for filtering and alerting
* **Custom metadata** - Add any key-value pairs relevant to your observability needs
### Session Tracking
Whenever a request carries the [`x-bf-session-id`](/providers/request-options) header, Bifrost tags the trace's root span with the OTEL-conventional `session.id` attribute. This happens **regardless** of the `group_traces_by_session` setting, so you can always filter and correlate traces by session in your backend even when each request remains its own trace.
### Grouping Traces by Session
By default, each request Bifrost handles becomes its own OTEL trace (still tagged with `session.id` as described above). Enable `group_traces_by_session` to instead group every request that carries the same `x-bf-session-id` header into a **single trace**, with each request's root span appearing as a top-level sibling under that trace. This is useful for viewing a multi-turn conversation or agent run as one trace in your backend.
```json theme={null}
{
"group_traces_by_session": true
}
```
When enabled, requests sharing a session ID adopt a deterministic trace ID derived from that session ID, so they land in the same trace regardless of which Bifrost node handled them.
An inbound [W3C `traceparent`](https://www.w3.org/TR/trace-context/) always takes precedence: a request that arrives on a distributed trace stays on that trace and is **not** regrouped by session. Session grouping only applies to requests that have a session ID but no incoming trace context.
Because all requests in a session share one trace, very long-lived sessions produce large traces. Use a session scope that matches how you want to view activity in your backend.
To send a session ID, pass the [`x-bf-session-id`](/providers/request-options) header on each request you want grouped together.
***
## Setup
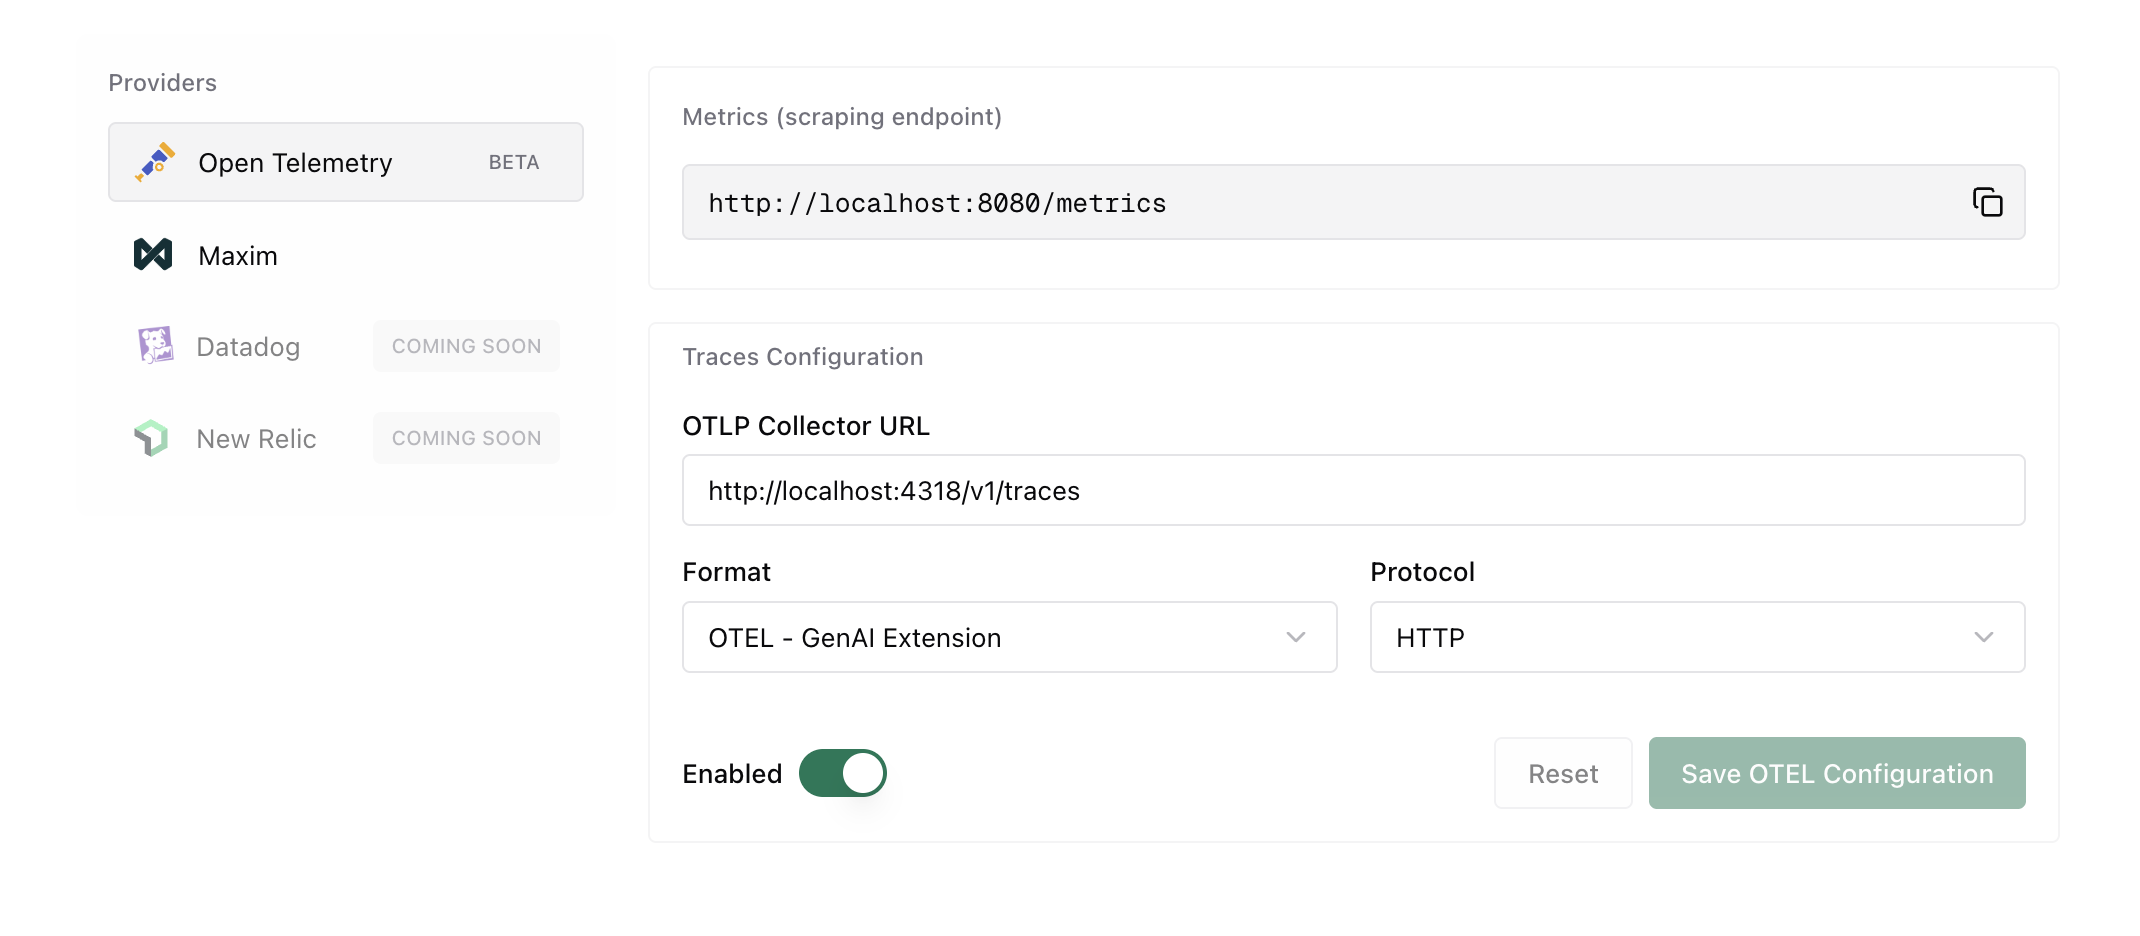 ```go theme={null}
package main
import (
"context"
bifrost "github.com/maximhq/bifrost/core"
"github.com/maximhq/bifrost/core/schemas"
"github.com/maximhq/bifrost/framework/pricing"
otel "github.com/maximhq/bifrost/plugins/otel"
)
func main() {
ctx := context.Background()
logger := schemas.NewLogger()
// Initialize pricing manager (required for cost calculation)
pricingManager := pricing.NewPricingManager(logger)
// Initialize OTel plugin
otelPlugin, err := otel.Init(ctx, &otel.Config{
ServiceName: "bifrost",
CollectorURL: "http://localhost:4318/v1/traces",
TraceType: otel.TraceTypeGenAIExtension,
Protocol: otel.ProtocolHTTP,
Headers: map[string]string{
"Authorization": "env.OTEL_API_KEY",
},
}, logger, pricingManager)
if err != nil {
panic(err)
}
// Initialize Bifrost with the plugin
client, err := bifrost.Init(ctx, schemas.BifrostConfig{
Account: &yourAccount,
LLMPlugins: []schemas.LLMPlugin{otelPlugin},
})
if err != nil {
panic(err)
}
defer client.Shutdown()
// All requests are now traced to OTel collector
}
```
For Gateway mode, configure via `config.json`:
```json theme={null}
{
"plugins": [
{
"enabled": true,
"name": "otel",
"config": {
"service_name": "bifrost",
"collector_url": "http://localhost:4318/v1/traces",
"trace_type": "genai_extension",
"protocol": "http",
"headers": {
"Authorization": "env.OTEL_API_KEY"
}
}
}
]
}
```
If you need to connect to an OTEL collector that requires TLS, configure `tls_ca_cert` and set insecure mode to `false`:
```json theme={null}
{
"plugins": [
{
"enabled": true,
"name": "otel",
"config": {
"service_name": "bifrost",
"collector_url": "localhost:4317",
"trace_type": "genai_extension",
"protocol": "grpc",
"insecure": false,
"tls_ca_cert": "/path/to/your/ca.cert",
"headers": {
"Authorization": "env.OTEL_API_KEY"
}
}
}
]
}
```
For Gateway mode, configure via `config.json`:
```json theme={null}
{
"plugins": [
{
"enabled": true,
"name": "otel",
"config": {
"profiles": [
{
"service_name": "bifrost",
"enabled": true,
"collector_url": "http://localhost:4318/v1/traces",
"trace_type": "genai_extension",
"protocol": "http",
"headers": {
"Authorization": "env.OTEL_API_KEY"
}
}
]
}
}
]
}
```
If you need to connect to an OTEL collector that requires TLS, configure `tls_ca_cert` and set insecure mode to `false`:
```json theme={null}
{
"plugins": [
{
"enabled": true,
"name": "otel",
"config": {
"profiles": [
{
"service_name": "bifrost",
"enabled": true,
"collector_url": "localhost:4317",
"trace_type": "genai_extension",
"protocol": "grpc",
"insecure": false,
"tls_ca_cert": "/path/to/your/ca.cert",
"headers": {
"Authorization": "env.OTEL_API_KEY"
}
}
]
}
}
]
}
```
***
## Quick Start with Docker
Get started quickly with a complete observability stack using the included Docker Compose configuration:
```yml theme={null}
services:
otel-collector:
image: otel/opentelemetry-collector-contrib:latest
container_name: otel-collector
command: ["--config=/etc/otelcol/config.yaml"]
configs:
- source: otel-collector-config
target: /etc/otelcol/config.yaml
ports:
- "4317:4317" # OTLP gRPC
- "4318:4318" # OTLP HTTP
- "8888:8888" # Collector /metrics
- "9464:9464" # Prometheus scrape endpoint
- "13133:13133" # Health check
- "1777:1777" # pprof
- "55679:55679" # zpages
restart: unless-stopped
depends_on:
- tempo
tempo:
image: grafana/tempo:latest
container_name: tempo
command: ["-target=all", "-config.file=/etc/tempo.yaml"]
configs:
- source: tempo-config
target: /etc/tempo.yaml
ports:
- "3200:3200" # Tempo HTTP API
expose:
- "4317" # OTLP gRPC (internal)
volumes:
- tempo-data:/var/tempo
restart: unless-stopped
prometheus:
image: prom/prometheus:latest
container_name: prometheus
command:
- "--config.file=/etc/prometheus/prometheus.yml"
- "--storage.tsdb.path=/prometheus"
- "--web.console.libraries=/usr/share/prometheus/console_libraries"
- "--web.console.templates=/usr/share/prometheus/consoles"
- "--web.enable-remote-write-receiver"
- "--enable-feature=exemplar-storage"
- "--enable-feature=native-histograms"
ports:
- "9090:9090"
volumes:
- prometheus-data:/prometheus
configs:
- source: prometheus-config
target: /etc/prometheus/prometheus.yml
depends_on:
- otel-collector
restart: unless-stopped
grafana:
image: grafana/grafana:latest
container_name: grafana
depends_on:
- prometheus
- tempo
environment:
GF_SECURITY_ADMIN_USER: admin
GF_SECURITY_ADMIN_PASSWORD: admin
GF_AUTH_ANONYMOUS_ENABLED: "true"
GF_AUTH_ANONYMOUS_ORG_ROLE: Viewer
GF_INSTALL_PLUGINS: ""
GF_FEATURE_TOGGLES_ENABLE: traceqlEditor
ports:
- "4000:3000"
volumes:
- grafana-data:/var/lib/grafana
configs:
- source: grafana-datasources
target: /etc/grafana/provisioning/datasources/datasources.yml
restart: unless-stopped
configs:
otel-collector-config:
content: |
receivers:
otlp:
protocols:
grpc:
endpoint: 0.0.0.0:4317
http:
endpoint: 0.0.0.0:4318
processors:
batch:
exporters:
prometheus:
endpoint: 0.0.0.0:9464
namespace: otel
const_labels:
source: otelcol
otlp/tempo:
endpoint: tempo:4317
tls:
insecure: true
debug:
verbosity: detailed
extensions:
health_check:
endpoint: 0.0.0.0:13133
pprof:
endpoint: 0.0.0.0:1777
zpages:
endpoint: 0.0.0.0:55679
service:
extensions: [health_check, pprof, zpages]
telemetry:
logs:
level: debug
metrics:
level: detailed
pipelines:
traces:
receivers: [otlp]
processors: [batch]
exporters: [debug, otlp/tempo]
metrics:
receivers: [otlp]
processors: [batch]
exporters: [debug, prometheus]
logs:
receivers: [otlp]
processors: [batch]
exporters: [debug]
tempo-config:
content: |
server:
http_listen_port: 3200
log_level: info
distributor:
receivers:
otlp:
protocols:
grpc:
endpoint: 0.0.0.0:4317
ingester:
max_block_duration: 5m
trace_idle_period: 10s
compactor:
compaction:
block_retention: 1h
storage:
trace:
backend: local
wal:
path: /var/tempo/wal
local:
path: /var/tempo/blocks
metrics_generator:
registry:
external_labels:
source: tempo
storage:
path: /var/tempo/generator/wal
remote_write:
- url: http://prometheus:9090/api/v1/write
prometheus-config:
content: |
global:
scrape_interval: 15s
scrape_configs:
- job_name: "otelcol-internal"
static_configs:
- targets: ["otel-collector:8888"]
- job_name: "otelcol-exporter"
static_configs:
- targets: ["otel-collector:9464"]
- job_name: "tempo"
static_configs:
- targets: ["tempo:3200"]
grafana-datasources:
content: |
apiVersion: 1
datasources:
- name: Prometheus
uid: prometheus
type: prometheus
access: proxy
orgId: 1
url: http://prometheus:9090
isDefault: true
editable: true
- name: Tempo
uid: tempo
type: tempo
access: proxy
orgId: 1
url: http://tempo:3200
editable: true
jsonData:
tracesToMetrics:
datasourceUid: prometheus
nodeGraph:
enabled: true
volumes:
prometheus-data:
grafana-data:
tempo-data:
```
This launches:
* **OTel Collector** - Receives traces on ports 4317 (gRPC) and 4318 (HTTP)
* **Tempo** - Distributed tracing backend
* **Prometheus** - Metrics collection
* **Grafana** - Visualization dashboard
Access Grafana at `http://localhost:3000` (default credentials: admin/admin)
***
## Popular Platform Integrations
```json theme={null}
{
"plugins": [
{
"enabled": true,
"name": "otel",
"config": {
"service_name": "bifrost",
"collector_url": "https://otlp-gateway-prod-us-central-0.grafana.net/otlp",
"trace_type": "genai_extension",
"protocol": "http",
"headers": {
"Authorization": "env.GRAFANA_CLOUD_API_KEY"
}
}
}
]
}
```
Set environment variable:
```bash theme={null}
export GRAFANA_CLOUD_API_KEY="Basic "
```
```json theme={null}
{
"plugins": [
{
"enabled": true,
"name": "otel",
"config": {
"service_name": "bifrost",
"collector_url": "https://trace.agent.datadoghq.com",
"trace_type": "genai_extension",
"protocol": "http",
"headers": {
"DD-API-KEY": "env.DATADOG_API_KEY"
}
}
}
]
}
```
Set environment variable:
```bash theme={null}
export DATADOG_API_KEY="your-datadog-api-key"
```
```json theme={null}
{
"plugins": [
{
"enabled": true,
"name": "otel",
"config": {
"service_name": "bifrost",
"collector_url": "https://otlp.nr-data.net:4318",
"trace_type": "genai_extension",
"protocol": "http",
"headers": {
"api-key": "env.NEW_RELIC_LICENSE_KEY"
}
}
}
]
}
```
Set environment variable:
```bash theme={null}
export NEW_RELIC_LICENSE_KEY="your-license-key"
```
```json theme={null}
{
"plugins": [
{
"enabled": true,
"name": "otel",
"config": {
"service_name": "bifrost",
"collector_url": "https://api.honeycomb.io",
"trace_type": "genai_extension",
"protocol": "http",
"headers": {
"x-honeycomb-team": "env.HONEYCOMB_API_KEY",
"x-honeycomb-dataset": "bifrost-traces"
}
}
}
]
}
```
Set environment variable:
```bash theme={null}
export HONEYCOMB_API_KEY="your-api-key"
```
[Langfuse](https://langfuse.com) is an open-source LLM observability platform that accepts OpenTelemetry traces via its OTLP endpoint.
Configure the OTel plugin with the following settings:
| Field | Value |
| ----------------- | ----------------------------------------------------------------------------------------------------------------------------- |
| **Collector URL** | `https://cloud.langfuse.com/api/public/otel/v1/traces` (EU) or `https://us.cloud.langfuse.com/api/public/otel/v1/traces` (US) |
| **Trace Type** | `genai_extension` |
| **Protocol** | `http` (required - Langfuse does not support gRPC) |
| **Headers** | `Authorization`: `env.LANGFUSE_AUTH` |
```json theme={null}
{
"plugins": [
{
"enabled": true,
"name": "otel",
"config": {
"service_name": "bifrost",
"collector_url": "https://cloud.langfuse.com/api/public/otel",
"trace_type": "genai_extension",
"protocol": "http",
"headers": {
"Authorization": "env.LANGFUSE_AUTH"
}
}
}
]
}
```
For US region, use `https://us.cloud.langfuse.com/api/public/otel` instead.
Set up the environment variable with your Langfuse API keys:
```bash theme={null}
# Generate base64 auth string from your Langfuse API keys
export LANGFUSE_AUTH="Basic $(echo -n 'pk-lf-xxx:sk-lf-xxx' | base64)"
```
Replace `pk-lf-xxx` and `sk-lf-xxx` with your Langfuse public and secret keys from your project settings.
Langfuse only supports HTTP protocol. Do not use gRPC.
See the [Langfuse OpenTelemetry documentation](https://langfuse.com/integrations/native/opentelemetry) for more details.
Use the included Docker Compose stack or point to your own collector:
```json theme={null}
{
"plugins": [
{
"enabled": true,
"name": "otel",
"config": {
"service_name": "bifrost",
"collector_url": "http://your-collector:4318",
"trace_type": "genai_extension",
"protocol": "http"
}
}
]
}
```
***
## Captured Data
Each trace includes comprehensive LLM operation metadata following OpenTelemetry semantic conventions:
### Span Attributes
* **Span Name**: Based on request type (`gen_ai.chat`, `gen_ai.text`, `gen_ai.embedding`, etc.)
* **Service Info**: `service.name=bifrost`, `service.version`
* **Provider & Model**: `gen_ai.provider.name`, `gen_ai.request.model`
* **Session**: `session.id` on the root span when the request carries an `x-bf-session-id` header (see [Session Tracking](#session-tracking))
### Request Parameters
* Temperature, max\_tokens, top\_p, stop sequences
* Presence/frequency penalties
* Tool configurations and parallel tool calls
* Custom parameters via `ExtraParams`
### Input/Output Data
* Complete chat history with role-based messages
* Prompt text for completions
* Response content with role attribution
* Tool calls and results
When Enterprise guardrail redaction is enabled, Bifrost applies trace redaction replacements before exporting completed traces to OTel. Exported span content receives the redacted or placeholderized value, but reversible reveal mappings are not exported. For the full mode matrix, see [Guardrail Redaction](/enterprise/guardrails/redaction).
### Controlling Exported Content
Two profile-level flags control how much message content leaves Bifrost:
| Flag | Effect |
| --------------------------- | ---------------------------------------------------------------------------------------------------------------------------------------------------------------------------------------------------------------------------------------------------------------------------------------------------------------------------------------------------------------------------------------------------------------------------------- |
| `disable_content_logging` | Drops input/output message content, prompt and instructions, model reasoning, tool definitions, and tool call arguments/results from **every** exported span. Metadata is still exported, including model, provider, tokens, cost, latency, status, and governance attribution. |
| `disable_root_span_content` | When used alone, drops content from the **root span only**. Bifrost duplicates input/output onto the root span for trace-level display; this removes that duplication while child spans keep full content. Useful when your backend indexes root-span attributes and you want to limit the blast radius without losing detail. `disable_content_logging` takes precedence: when it is enabled, child spans lose their content too. |
```json theme={null}
{
"name": "otel",
"config": {
"collector_url": "http://localhost:4318",
"trace_type": "genai_extension",
"protocol": "http",
"disable_content_logging": true
}
}
```
These flags are **independent** of the global `client.disable_content_logging`, which governs the Bifrost log store only. Setting the client flag does not stop content from being exported to your OTLP collector. Set `disable_content_logging` on the OTel profile as well.
Values captured via `request_headers` are attached to the root span **regardless** of either flag. Only enable header capture for headers you intend to export.
### Performance Metrics
* Token usage (prompt, completion, total)
* Cost calculations in dollars
* Latency and timing (start/end timestamps)
* Error details with status codes
### Caller-Supplied Headers
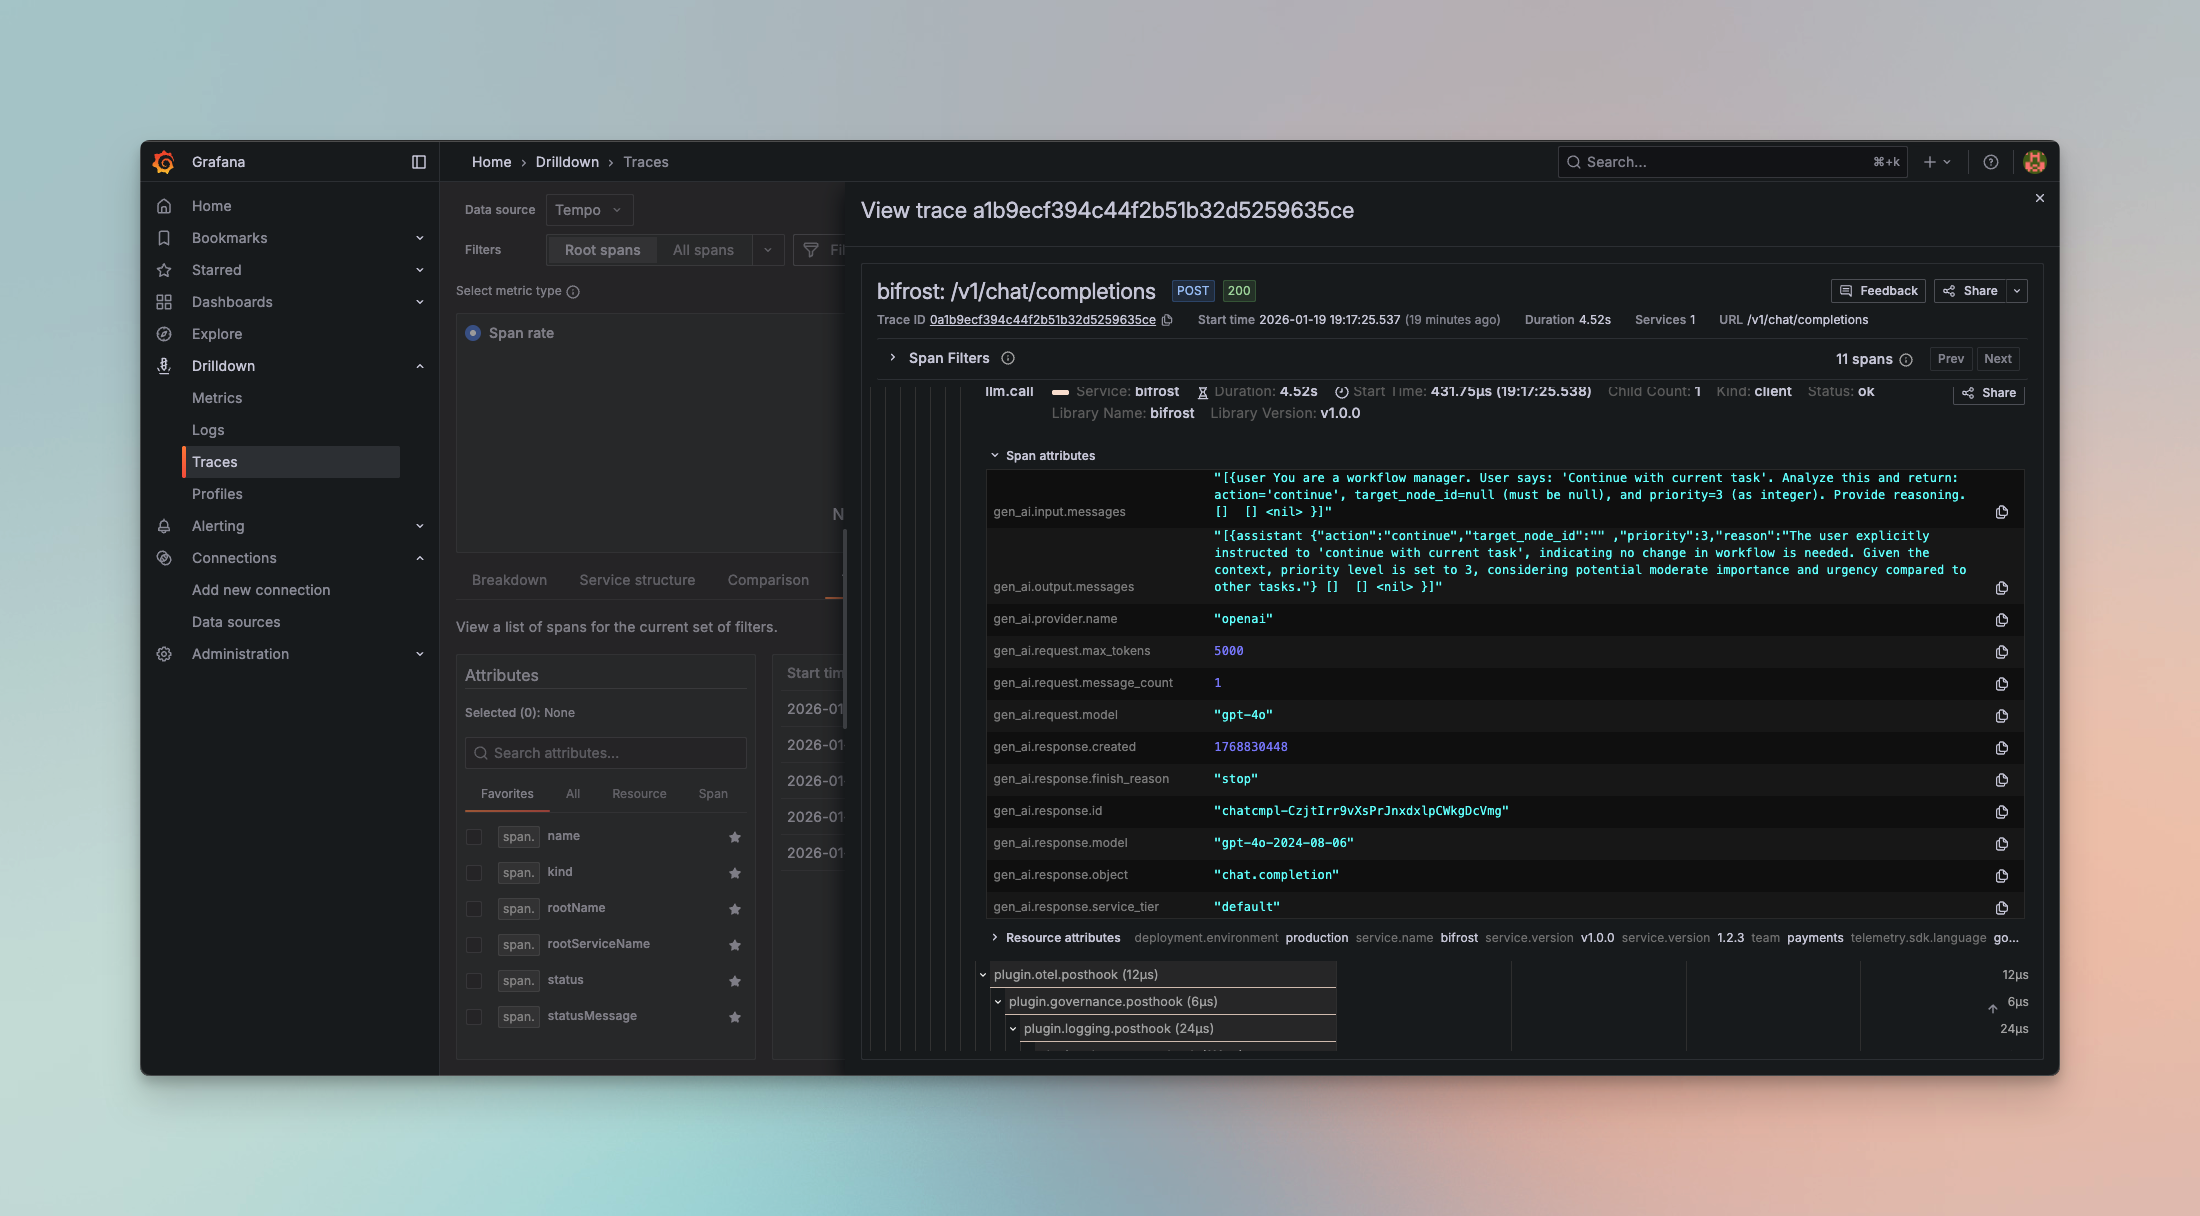
Headers Bifrost forwards to the upstream provider — both `x-bf-eh-*` prefixed headers and headers matched by the [direct allowlist](/deployment-guides/config-json/client#header-filtering) — are also surfaced on the `llm.call` span as `gen_ai.request.extra_header.` attributes. This makes it easy to filter or correlate traces by caller context (session ID, tenant ID, correlation IDs) without standing up extra plumbing.
For example, sending `x-bf-eh-session-id: sess-abc-123` produces the span attribute `gen_ai.request.extra_header.session-id = "sess-abc-123"`. See [Extra Headers](/providers/request-options#extra-headers-x-bf-eh) for the full request format.
### Example Span
```json theme={null}
{
"name": "gen_ai.chat",
"attributes": {
"gen_ai.provider.name": "openai",
"gen_ai.request.model": "gpt-4",
"gen_ai.request.temperature": 0.7,
"gen_ai.request.max_tokens": 1000,
"gen_ai.usage.prompt_tokens": 45,
"gen_ai.usage.completion_tokens": 128,
"gen_ai.usage.total_tokens": 173,
"gen_ai.usage.cost": 0.0052
}
}
```
```go theme={null}
package main
import (
"context"
bifrost "github.com/maximhq/bifrost/core"
"github.com/maximhq/bifrost/core/schemas"
"github.com/maximhq/bifrost/framework/pricing"
otel "github.com/maximhq/bifrost/plugins/otel"
)
func main() {
ctx := context.Background()
logger := schemas.NewLogger()
// Initialize pricing manager (required for cost calculation)
pricingManager := pricing.NewPricingManager(logger)
// Initialize OTel plugin
otelPlugin, err := otel.Init(ctx, &otel.Config{
ServiceName: "bifrost",
CollectorURL: "http://localhost:4318/v1/traces",
TraceType: otel.TraceTypeGenAIExtension,
Protocol: otel.ProtocolHTTP,
Headers: map[string]string{
"Authorization": "env.OTEL_API_KEY",
},
}, logger, pricingManager)
if err != nil {
panic(err)
}
// Initialize Bifrost with the plugin
client, err := bifrost.Init(ctx, schemas.BifrostConfig{
Account: &yourAccount,
LLMPlugins: []schemas.LLMPlugin{otelPlugin},
})
if err != nil {
panic(err)
}
defer client.Shutdown()
// All requests are now traced to OTel collector
}
```
For Gateway mode, configure via `config.json`:
```json theme={null}
{
"plugins": [
{
"enabled": true,
"name": "otel",
"config": {
"service_name": "bifrost",
"collector_url": "http://localhost:4318/v1/traces",
"trace_type": "genai_extension",
"protocol": "http",
"headers": {
"Authorization": "env.OTEL_API_KEY"
}
}
}
]
}
```
If you need to connect to an OTEL collector that requires TLS, configure `tls_ca_cert` and set insecure mode to `false`:
```json theme={null}
{
"plugins": [
{
"enabled": true,
"name": "otel",
"config": {
"service_name": "bifrost",
"collector_url": "localhost:4317",
"trace_type": "genai_extension",
"protocol": "grpc",
"insecure": false,
"tls_ca_cert": "/path/to/your/ca.cert",
"headers": {
"Authorization": "env.OTEL_API_KEY"
}
}
}
]
}
```
For Gateway mode, configure via `config.json`:
```json theme={null}
{
"plugins": [
{
"enabled": true,
"name": "otel",
"config": {
"profiles": [
{
"service_name": "bifrost",
"enabled": true,
"collector_url": "http://localhost:4318/v1/traces",
"trace_type": "genai_extension",
"protocol": "http",
"headers": {
"Authorization": "env.OTEL_API_KEY"
}
}
]
}
}
]
}
```
If you need to connect to an OTEL collector that requires TLS, configure `tls_ca_cert` and set insecure mode to `false`:
```json theme={null}
{
"plugins": [
{
"enabled": true,
"name": "otel",
"config": {
"profiles": [
{
"service_name": "bifrost",
"enabled": true,
"collector_url": "localhost:4317",
"trace_type": "genai_extension",
"protocol": "grpc",
"insecure": false,
"tls_ca_cert": "/path/to/your/ca.cert",
"headers": {
"Authorization": "env.OTEL_API_KEY"
}
}
]
}
}
]
}
```
***
## Quick Start with Docker
Get started quickly with a complete observability stack using the included Docker Compose configuration:
```yml theme={null}
services:
otel-collector:
image: otel/opentelemetry-collector-contrib:latest
container_name: otel-collector
command: ["--config=/etc/otelcol/config.yaml"]
configs:
- source: otel-collector-config
target: /etc/otelcol/config.yaml
ports:
- "4317:4317" # OTLP gRPC
- "4318:4318" # OTLP HTTP
- "8888:8888" # Collector /metrics
- "9464:9464" # Prometheus scrape endpoint
- "13133:13133" # Health check
- "1777:1777" # pprof
- "55679:55679" # zpages
restart: unless-stopped
depends_on:
- tempo
tempo:
image: grafana/tempo:latest
container_name: tempo
command: ["-target=all", "-config.file=/etc/tempo.yaml"]
configs:
- source: tempo-config
target: /etc/tempo.yaml
ports:
- "3200:3200" # Tempo HTTP API
expose:
- "4317" # OTLP gRPC (internal)
volumes:
- tempo-data:/var/tempo
restart: unless-stopped
prometheus:
image: prom/prometheus:latest
container_name: prometheus
command:
- "--config.file=/etc/prometheus/prometheus.yml"
- "--storage.tsdb.path=/prometheus"
- "--web.console.libraries=/usr/share/prometheus/console_libraries"
- "--web.console.templates=/usr/share/prometheus/consoles"
- "--web.enable-remote-write-receiver"
- "--enable-feature=exemplar-storage"
- "--enable-feature=native-histograms"
ports:
- "9090:9090"
volumes:
- prometheus-data:/prometheus
configs:
- source: prometheus-config
target: /etc/prometheus/prometheus.yml
depends_on:
- otel-collector
restart: unless-stopped
grafana:
image: grafana/grafana:latest
container_name: grafana
depends_on:
- prometheus
- tempo
environment:
GF_SECURITY_ADMIN_USER: admin
GF_SECURITY_ADMIN_PASSWORD: admin
GF_AUTH_ANONYMOUS_ENABLED: "true"
GF_AUTH_ANONYMOUS_ORG_ROLE: Viewer
GF_INSTALL_PLUGINS: ""
GF_FEATURE_TOGGLES_ENABLE: traceqlEditor
ports:
- "4000:3000"
volumes:
- grafana-data:/var/lib/grafana
configs:
- source: grafana-datasources
target: /etc/grafana/provisioning/datasources/datasources.yml
restart: unless-stopped
configs:
otel-collector-config:
content: |
receivers:
otlp:
protocols:
grpc:
endpoint: 0.0.0.0:4317
http:
endpoint: 0.0.0.0:4318
processors:
batch:
exporters:
prometheus:
endpoint: 0.0.0.0:9464
namespace: otel
const_labels:
source: otelcol
otlp/tempo:
endpoint: tempo:4317
tls:
insecure: true
debug:
verbosity: detailed
extensions:
health_check:
endpoint: 0.0.0.0:13133
pprof:
endpoint: 0.0.0.0:1777
zpages:
endpoint: 0.0.0.0:55679
service:
extensions: [health_check, pprof, zpages]
telemetry:
logs:
level: debug
metrics:
level: detailed
pipelines:
traces:
receivers: [otlp]
processors: [batch]
exporters: [debug, otlp/tempo]
metrics:
receivers: [otlp]
processors: [batch]
exporters: [debug, prometheus]
logs:
receivers: [otlp]
processors: [batch]
exporters: [debug]
tempo-config:
content: |
server:
http_listen_port: 3200
log_level: info
distributor:
receivers:
otlp:
protocols:
grpc:
endpoint: 0.0.0.0:4317
ingester:
max_block_duration: 5m
trace_idle_period: 10s
compactor:
compaction:
block_retention: 1h
storage:
trace:
backend: local
wal:
path: /var/tempo/wal
local:
path: /var/tempo/blocks
metrics_generator:
registry:
external_labels:
source: tempo
storage:
path: /var/tempo/generator/wal
remote_write:
- url: http://prometheus:9090/api/v1/write
prometheus-config:
content: |
global:
scrape_interval: 15s
scrape_configs:
- job_name: "otelcol-internal"
static_configs:
- targets: ["otel-collector:8888"]
- job_name: "otelcol-exporter"
static_configs:
- targets: ["otel-collector:9464"]
- job_name: "tempo"
static_configs:
- targets: ["tempo:3200"]
grafana-datasources:
content: |
apiVersion: 1
datasources:
- name: Prometheus
uid: prometheus
type: prometheus
access: proxy
orgId: 1
url: http://prometheus:9090
isDefault: true
editable: true
- name: Tempo
uid: tempo
type: tempo
access: proxy
orgId: 1
url: http://tempo:3200
editable: true
jsonData:
tracesToMetrics:
datasourceUid: prometheus
nodeGraph:
enabled: true
volumes:
prometheus-data:
grafana-data:
tempo-data:
```
This launches:
* **OTel Collector** - Receives traces on ports 4317 (gRPC) and 4318 (HTTP)
* **Tempo** - Distributed tracing backend
* **Prometheus** - Metrics collection
* **Grafana** - Visualization dashboard
Access Grafana at `http://localhost:3000` (default credentials: admin/admin)
***
## Popular Platform Integrations
```json theme={null}
{
"plugins": [
{
"enabled": true,
"name": "otel",
"config": {
"service_name": "bifrost",
"collector_url": "https://otlp-gateway-prod-us-central-0.grafana.net/otlp",
"trace_type": "genai_extension",
"protocol": "http",
"headers": {
"Authorization": "env.GRAFANA_CLOUD_API_KEY"
}
}
}
]
}
```
Set environment variable:
```bash theme={null}
export GRAFANA_CLOUD_API_KEY="Basic "
```
```json theme={null}
{
"plugins": [
{
"enabled": true,
"name": "otel",
"config": {
"service_name": "bifrost",
"collector_url": "https://trace.agent.datadoghq.com",
"trace_type": "genai_extension",
"protocol": "http",
"headers": {
"DD-API-KEY": "env.DATADOG_API_KEY"
}
}
}
]
}
```
Set environment variable:
```bash theme={null}
export DATADOG_API_KEY="your-datadog-api-key"
```
```json theme={null}
{
"plugins": [
{
"enabled": true,
"name": "otel",
"config": {
"service_name": "bifrost",
"collector_url": "https://otlp.nr-data.net:4318",
"trace_type": "genai_extension",
"protocol": "http",
"headers": {
"api-key": "env.NEW_RELIC_LICENSE_KEY"
}
}
}
]
}
```
Set environment variable:
```bash theme={null}
export NEW_RELIC_LICENSE_KEY="your-license-key"
```
```json theme={null}
{
"plugins": [
{
"enabled": true,
"name": "otel",
"config": {
"service_name": "bifrost",
"collector_url": "https://api.honeycomb.io",
"trace_type": "genai_extension",
"protocol": "http",
"headers": {
"x-honeycomb-team": "env.HONEYCOMB_API_KEY",
"x-honeycomb-dataset": "bifrost-traces"
}
}
}
]
}
```
Set environment variable:
```bash theme={null}
export HONEYCOMB_API_KEY="your-api-key"
```
[Langfuse](https://langfuse.com) is an open-source LLM observability platform that accepts OpenTelemetry traces via its OTLP endpoint.
Configure the OTel plugin with the following settings:
| Field | Value |
| ----------------- | ----------------------------------------------------------------------------------------------------------------------------- |
| **Collector URL** | `https://cloud.langfuse.com/api/public/otel/v1/traces` (EU) or `https://us.cloud.langfuse.com/api/public/otel/v1/traces` (US) |
| **Trace Type** | `genai_extension` |
| **Protocol** | `http` (required - Langfuse does not support gRPC) |
| **Headers** | `Authorization`: `env.LANGFUSE_AUTH` |
```json theme={null}
{
"plugins": [
{
"enabled": true,
"name": "otel",
"config": {
"service_name": "bifrost",
"collector_url": "https://cloud.langfuse.com/api/public/otel",
"trace_type": "genai_extension",
"protocol": "http",
"headers": {
"Authorization": "env.LANGFUSE_AUTH"
}
}
}
]
}
```
For US region, use `https://us.cloud.langfuse.com/api/public/otel` instead.
Set up the environment variable with your Langfuse API keys:
```bash theme={null}
# Generate base64 auth string from your Langfuse API keys
export LANGFUSE_AUTH="Basic $(echo -n 'pk-lf-xxx:sk-lf-xxx' | base64)"
```
Replace `pk-lf-xxx` and `sk-lf-xxx` with your Langfuse public and secret keys from your project settings.
Langfuse only supports HTTP protocol. Do not use gRPC.
See the [Langfuse OpenTelemetry documentation](https://langfuse.com/integrations/native/opentelemetry) for more details.
Use the included Docker Compose stack or point to your own collector:
```json theme={null}
{
"plugins": [
{
"enabled": true,
"name": "otel",
"config": {
"service_name": "bifrost",
"collector_url": "http://your-collector:4318",
"trace_type": "genai_extension",
"protocol": "http"
}
}
]
}
```
***
## Captured Data
Each trace includes comprehensive LLM operation metadata following OpenTelemetry semantic conventions:
### Span Attributes
* **Span Name**: Based on request type (`gen_ai.chat`, `gen_ai.text`, `gen_ai.embedding`, etc.)
* **Service Info**: `service.name=bifrost`, `service.version`
* **Provider & Model**: `gen_ai.provider.name`, `gen_ai.request.model`
* **Session**: `session.id` on the root span when the request carries an `x-bf-session-id` header (see [Session Tracking](#session-tracking))
### Request Parameters
* Temperature, max\_tokens, top\_p, stop sequences
* Presence/frequency penalties
* Tool configurations and parallel tool calls
* Custom parameters via `ExtraParams`
### Input/Output Data
* Complete chat history with role-based messages
* Prompt text for completions
* Response content with role attribution
* Tool calls and results
When Enterprise guardrail redaction is enabled, Bifrost applies trace redaction replacements before exporting completed traces to OTel. Exported span content receives the redacted or placeholderized value, but reversible reveal mappings are not exported. For the full mode matrix, see [Guardrail Redaction](/enterprise/guardrails/redaction).
### Controlling Exported Content
Two profile-level flags control how much message content leaves Bifrost:
| Flag | Effect |
| --------------------------- | ---------------------------------------------------------------------------------------------------------------------------------------------------------------------------------------------------------------------------------------------------------------------------------------------------------------------------------------------------------------------------------------------------------------------------------- |
| `disable_content_logging` | Drops input/output message content, prompt and instructions, model reasoning, tool definitions, and tool call arguments/results from **every** exported span. Metadata is still exported, including model, provider, tokens, cost, latency, status, and governance attribution. |
| `disable_root_span_content` | When used alone, drops content from the **root span only**. Bifrost duplicates input/output onto the root span for trace-level display; this removes that duplication while child spans keep full content. Useful when your backend indexes root-span attributes and you want to limit the blast radius without losing detail. `disable_content_logging` takes precedence: when it is enabled, child spans lose their content too. |
```json theme={null}
{
"name": "otel",
"config": {
"collector_url": "http://localhost:4318",
"trace_type": "genai_extension",
"protocol": "http",
"disable_content_logging": true
}
}
```
These flags are **independent** of the global `client.disable_content_logging`, which governs the Bifrost log store only. Setting the client flag does not stop content from being exported to your OTLP collector. Set `disable_content_logging` on the OTel profile as well.
Values captured via `request_headers` are attached to the root span **regardless** of either flag. Only enable header capture for headers you intend to export.
### Performance Metrics
* Token usage (prompt, completion, total)
* Cost calculations in dollars
* Latency and timing (start/end timestamps)
* Error details with status codes
### Caller-Supplied Headers
Headers Bifrost forwards to the upstream provider — both `x-bf-eh-*` prefixed headers and headers matched by the [direct allowlist](/deployment-guides/config-json/client#header-filtering) — are also surfaced on the `llm.call` span as `gen_ai.request.extra_header.` attributes. This makes it easy to filter or correlate traces by caller context (session ID, tenant ID, correlation IDs) without standing up extra plumbing.
For example, sending `x-bf-eh-session-id: sess-abc-123` produces the span attribute `gen_ai.request.extra_header.session-id = "sess-abc-123"`. See [Extra Headers](/providers/request-options#extra-headers-x-bf-eh) for the full request format.
### Example Span
```json theme={null}
{
"name": "gen_ai.chat",
"attributes": {
"gen_ai.provider.name": "openai",
"gen_ai.request.model": "gpt-4",
"gen_ai.request.temperature": 0.7,
"gen_ai.request.max_tokens": 1000,
"gen_ai.usage.prompt_tokens": 45,
"gen_ai.usage.completion_tokens": 128,
"gen_ai.usage.total_tokens": 173,
"gen_ai.usage.cost": 0.0052
}
}
```
 ***
## Supported Request Types
The OTel plugin captures all Bifrost request types:
* **Chat Completion** (streaming and non-streaming) → `gen_ai.chat`
* **Text Completion** (streaming and non-streaming) → `gen_ai.text`
* **Embeddings** → `gen_ai.embedding`
* **Speech Generation** (streaming and non-streaming) → `gen_ai.speech`
* **Transcription** (streaming and non-streaming) → `gen_ai.transcription`
* **Responses API** → `gen_ai.responses`
* **MCP Tool Calls** → MCP client spans with `mcp.method.name`, plus `gen_ai.tool.name`, `network.transport`, and governance identity when available, and `error.type` on error spans
***
## Protocol Support
### HTTP (OTLP/HTTP)
Uses HTTP/1.1 or HTTP/2 with JSON or Protobuf encoding:
```json theme={null}
{
"collector_url": "http://localhost:4318/v1/traces",
"protocol": "http"
}
```
Default port: **4318**
### gRPC (OTLP/gRPC)
Uses gRPC with Protobuf encoding for lower latency:
```json theme={null}
{
"collector_url": "localhost:4317",
"protocol": "grpc"
}
```
Default port: **4317**
***
## Metrics Push (Cluster Mode)
**Multi-node deployments**: If you are running multiple Bifrost nodes, use push-based metrics for accurate aggregation. Pull-based `/metrics` scraping may miss nodes behind a load balancer.
The OTel plugin supports **push-based metrics export** via OTLP, which is essential for multi-node cluster deployments. Instead of relying on Prometheus scraping each node's `/metrics` endpoint (which can miss nodes behind a load balancer), all nodes actively push metrics to a central OTEL Collector.
MCP client operations are exported as `mcp.client.operation.duration` (histogram, seconds) following the OTel MCP semantic conventions, dimensioned by `mcp.method.name`, `gen_ai.tool.name`, `network.transport`, `error.type`, and the governance dimensions `virtual_key_id`, `virtual_key_name`, `team_id`, `team_name`, `customer_id`, `customer_name`, `business_unit_id`, `business_unit_name`. This histogram covers all MCP client methods (`tools/call`, `tools/list`, `ping`, `initialize`) — to measure tool calls only, filter for `mcp.method.name="tools/call"`.
### Configuration
| Field | Type | Required | Description |
| ----------------------- | ------------------ | ------------------ | ------------------------------------------------------ |
| `metrics_enabled` | `boolean` | ❌ No | Enable push-based metrics export (default: `false`) |
| `metrics_endpoint` | `string \| EnvVar` | ✅ Yes (if enabled) | OTLP metrics endpoint URL — supports `env.VAR_NAME` |
| `metrics_push_interval` | `integer` | ❌ No | Push interval in seconds (default: `15`, range: 1-300) |
### Example Configuration
```json theme={null}
{
"plugins": [
{
"enabled": true,
"name": "otel",
"config": {
"service_name": "bifrost",
"collector_url": "http://otel-collector:4318/v1/traces",
"trace_type": "genai_extension",
"protocol": "http",
"metrics_enabled": true,
"metrics_endpoint": "http://otel-collector:4318/v1/metrics",
"metrics_push_interval": 15
}
}
]
}
```
```json theme={null}
{
"plugins": [
{
"enabled": true,
"name": "otel",
"config": {
"profiles": [
{
"service_name": "bifrost",
"enabled": true,
"collector_url": "http://otel-collector:4318/v1/traces",
"trace_type": "genai_extension",
"protocol": "http",
"metrics_enabled": true,
"metrics_endpoint": "http://otel-collector:4318/v1/metrics",
"metrics_push_interval": 15
}
]
}
}
]
}
```
```json theme={null}
{
"plugins": [
{
"enabled": true,
"name": "otel",
"config": {
"service_name": "bifrost",
"collector_url": "otel-collector:4317",
"trace_type": "genai_extension",
"protocol": "grpc",
"metrics_enabled": true,
"metrics_endpoint": "otel-collector:4317",
"metrics_push_interval": 15
}
}
]
}
```
```json theme={null}
{
"plugins": [
{
"enabled": true,
"name": "otel",
"config": {
"profiles": [
{
"service_name": "bifrost",
"enabled": true,
"collector_url": "otel-collector:4317",
"trace_type": "genai_extension",
"protocol": "grpc",
"metrics_enabled": true,
"metrics_endpoint": "otel-collector:4317",
"metrics_push_interval": 15
}
]
}
}
]
}
```
### Pushed Metrics
These are the same **Prometheus-style metrics** from the telemetry plugin, pushed via OTLP protocol to a central collector:
| Metric | Type | Description |
| -------------------------------------------- | --------- | -------------------------------------- |
| `bifrost_upstream_requests_total` | Counter | Total requests to upstream providers |
| `bifrost_success_requests_total` | Counter | Successful upstream requests |
| `bifrost_error_requests_total` | Counter | Error requests with status code labels |
| `bifrost_input_tokens_total` | Counter | Total input tokens |
| `bifrost_output_tokens_total` | Counter | Total output tokens |
| `bifrost_cache_hits_total` | Counter | Cache hits |
| `bifrost_cost_total` | Counter | Total cost in USD |
| `bifrost_upstream_latency_seconds` | Histogram | Upstream request latency |
| `bifrost_stream_first_token_latency_seconds` | Histogram | Time to first token |
| `bifrost_stream_inter_token_latency_seconds` | Histogram | Inter-token latency |
| `http_requests_total` | Counter | Total HTTP requests |
| `http_request_duration_seconds` | Histogram | HTTP request duration |
| `http_request_size_bytes` | Histogram | HTTP request body size |
| `http_response_size_bytes` | Histogram | HTTP response body size |
> **Note:** Size metrics are only recorded when the `Content-Length` header is present. Requests or responses without it (e.g., chunked transfer encoding, streaming responses) do not produce data points in these histograms.
### OTEL Collector Configuration
Configure your OTEL Collector to receive OTLP metrics and export to your preferred backend (Datadog, Prometheus, etc.):
```yaml theme={null}
receivers:
otlp:
protocols:
grpc:
endpoint: 0.0.0.0:4317
http:
endpoint: 0.0.0.0:4318
processors:
batch:
timeout: 10s
send_batch_size: 1000
exporters:
# For Datadog
datadog:
api:
key: ${DD_API_KEY}
# Or for Prometheus remote write
prometheusremotewrite:
endpoint: "http://prometheus:9090/api/v1/write"
service:
pipelines:
metrics:
receivers: [otlp]
processors: [batch]
exporters: [datadog] # or prometheusremotewrite
```
### Why Push vs Pull?
| Aspect | Pull (`/metrics` scrape) | Push (OTEL metrics) |
| --------------------- | ------------------------ | -------------------- |
| Load balancer | May miss nodes | All nodes push |
| Service discovery | Required | Not required |
| Scraper configuration | Per-node endpoints | Single collector |
| Cluster aggregation | Query-side `sum()` | Collector handles it |
For **single-node deployments**, pull-based `/metrics` scraping works well. For **multi-node clusters**, push-based metrics ensures all nodes are captured.
***
## Advanced Features
### Automatic Span Management
* Spans are tracked with a **20-minute TTL** using an efficient sync.Map implementation
* Automatic cleanup prevents memory leaks for long-running processes
* Handles streaming requests with accumulator for chunked responses
### Async Emission
All span emissions happen asynchronously in background goroutines:
```go theme={null}
// Zero impact on request latency
go func() {
p.client.Emit(ctx, spans)
}()
```
### Streaming Support
The plugin accumulates streaming chunks and emits a single complete span when the stream finishes, providing accurate token counts and costs.
### Environment Variable Security
Sensitive URLs and credentials never need to appear in stored configuration. The `collector_url`, `metrics_endpoint`, and header values all accept the `env.VAR_NAME` format:
```json theme={null}
{
"collector_url": "env.OTEL_COLLECTOR_URL",
"metrics_endpoint": "env.OTEL_METRICS_ENDPOINT",
"headers": {
"Authorization": "env.OTEL_API_KEY"
}
}
```
The plugin resolves each `env.VAR_NAME` reference from the process environment at runtime. Stored configuration (database or config file) retains the `env.VAR_NAME` string — the resolved value is never persisted. API responses return `EnvVar` objects with sensitive resolved values redacted.
### Filtering Plugin Spans
By default every plugin's pre- and post-hook execution generates a span, which can bloat traces when many plugins are active (e.g. 8 built-in plugins × 2 hooks = 16 plugin spans per request). Use `plugin_span_filter` inside the OTEL plugin config to control which plugin spans are exported.
**Via config.json** (inside the OTEL plugin config):
```json theme={null}
{
"plugins": [
{
"name": "otel",
"enabled": true,
"config": {
"collector_url": "...",
"trace_type": "genai_extension",
"protocol": "http",
"plugin_span_filter": {
"mode": "exclude",
"plugins": ["logging", "compat", "telemetry", "otel"]
}
}
}
]
}
```
**Via the UI**: Open the **Observability** page, select the **Open Telemetry** connector, and click **Configure Plugin Tracing**. Toggle individual plugins on or off and save. UI-saved settings persist across restarts unless `plugin_span_filter` is set in config.json with a higher `version` value.
**Filter modes:**
| Mode | Behaviour |
| --------- | ---------------------------------------------------- |
| `exclude` | Export spans for all plugins **except** those listed |
| `include` | Export spans **only** for the listed plugins |
**Plugin names:** list each plugin using the exact name shown for it in the **Configure Plugin Tracing** sheet — this is the same name that appears in the span (`plugin..`), and it is what the filter matches against. The built-in OSS plugins are `telemetry`, `prompts`, `logging`, `governance`, `otel`, `semantic_cache`, `compat`, and `maxim`. In enterprise deployments some plugins are registered under a different name than their config key — for example the prompts and governance plugins appear as `enterprise-prompts` and `enterprise-governance` — so always copy the name from the tracing sheet rather than assuming the config key.
When a plugin span is filtered out, its children are automatically re-parented to the nearest exported ancestor so the trace hierarchy stays connected.
`plugin_span_filter` follows the standard plugin config precedence rules. To make a config.json value override UI-saved DB settings on restart, set a higher `version` on the OTEL plugin entry (e.g. `"version": 2`). See [Plugin Versioning](/deployment-guides/config-json/plugins) for details.
***
## When to Use
### OTel Plugin
Choose the OTel plugin when you:
* Have existing OpenTelemetry infrastructure
* Need to correlate LLM traces with application traces
* Require compliance with enterprise observability standards
* Want vendor flexibility (switch backends without code changes)
* Need multi-service distributed tracing
### vs. Built-in Observability
Use [Built-in Observability](./default) for:
* Local development and testing
* Simple self-hosted deployments
* No external dependencies
* Direct database access to logs
### vs. Maxim Plugin
Use the [Maxim Plugin](./maxim) for:
* Advanced LLM evaluation and testing
* Prompt engineering and experimentation
* Team collaboration and governance
* Production monitoring with alerts
* Dataset management and curation
***
## Troubleshooting
### Connection Issues
Verify collector is reachable:
```bash theme={null}
# Test HTTP endpoint
curl -v http://localhost:4318/v1/traces
# Test gRPC endpoint (requires grpcurl)
grpcurl -plaintext localhost:4317 list
```
### Missing Traces
Check Bifrost logs for emission errors:
```bash theme={null}
# Enable debug logging
bifrost-http --log-level debug
```
### Authentication Failures
Verify environment variables are set:
```bash theme={null}
echo $OTEL_API_KEY
```
***
## Next Steps
* **[Built-in Observability](./default)** - Local logging for development
* **[Maxim Plugin](./maxim)** - Advanced LLM evaluation and monitoring
* **[Telemetry](../telemetry)** - Prometheus metrics and dashboards
***
## Supported Request Types
The OTel plugin captures all Bifrost request types:
* **Chat Completion** (streaming and non-streaming) → `gen_ai.chat`
* **Text Completion** (streaming and non-streaming) → `gen_ai.text`
* **Embeddings** → `gen_ai.embedding`
* **Speech Generation** (streaming and non-streaming) → `gen_ai.speech`
* **Transcription** (streaming and non-streaming) → `gen_ai.transcription`
* **Responses API** → `gen_ai.responses`
* **MCP Tool Calls** → MCP client spans with `mcp.method.name`, plus `gen_ai.tool.name`, `network.transport`, and governance identity when available, and `error.type` on error spans
***
## Protocol Support
### HTTP (OTLP/HTTP)
Uses HTTP/1.1 or HTTP/2 with JSON or Protobuf encoding:
```json theme={null}
{
"collector_url": "http://localhost:4318/v1/traces",
"protocol": "http"
}
```
Default port: **4318**
### gRPC (OTLP/gRPC)
Uses gRPC with Protobuf encoding for lower latency:
```json theme={null}
{
"collector_url": "localhost:4317",
"protocol": "grpc"
}
```
Default port: **4317**
***
## Metrics Push (Cluster Mode)
**Multi-node deployments**: If you are running multiple Bifrost nodes, use push-based metrics for accurate aggregation. Pull-based `/metrics` scraping may miss nodes behind a load balancer.
The OTel plugin supports **push-based metrics export** via OTLP, which is essential for multi-node cluster deployments. Instead of relying on Prometheus scraping each node's `/metrics` endpoint (which can miss nodes behind a load balancer), all nodes actively push metrics to a central OTEL Collector.
MCP client operations are exported as `mcp.client.operation.duration` (histogram, seconds) following the OTel MCP semantic conventions, dimensioned by `mcp.method.name`, `gen_ai.tool.name`, `network.transport`, `error.type`, and the governance dimensions `virtual_key_id`, `virtual_key_name`, `team_id`, `team_name`, `customer_id`, `customer_name`, `business_unit_id`, `business_unit_name`. This histogram covers all MCP client methods (`tools/call`, `tools/list`, `ping`, `initialize`) — to measure tool calls only, filter for `mcp.method.name="tools/call"`.
### Configuration
| Field | Type | Required | Description |
| ----------------------- | ------------------ | ------------------ | ------------------------------------------------------ |
| `metrics_enabled` | `boolean` | ❌ No | Enable push-based metrics export (default: `false`) |
| `metrics_endpoint` | `string \| EnvVar` | ✅ Yes (if enabled) | OTLP metrics endpoint URL — supports `env.VAR_NAME` |
| `metrics_push_interval` | `integer` | ❌ No | Push interval in seconds (default: `15`, range: 1-300) |
### Example Configuration
```json theme={null}
{
"plugins": [
{
"enabled": true,
"name": "otel",
"config": {
"service_name": "bifrost",
"collector_url": "http://otel-collector:4318/v1/traces",
"trace_type": "genai_extension",
"protocol": "http",
"metrics_enabled": true,
"metrics_endpoint": "http://otel-collector:4318/v1/metrics",
"metrics_push_interval": 15
}
}
]
}
```
```json theme={null}
{
"plugins": [
{
"enabled": true,
"name": "otel",
"config": {
"profiles": [
{
"service_name": "bifrost",
"enabled": true,
"collector_url": "http://otel-collector:4318/v1/traces",
"trace_type": "genai_extension",
"protocol": "http",
"metrics_enabled": true,
"metrics_endpoint": "http://otel-collector:4318/v1/metrics",
"metrics_push_interval": 15
}
]
}
}
]
}
```
```json theme={null}
{
"plugins": [
{
"enabled": true,
"name": "otel",
"config": {
"service_name": "bifrost",
"collector_url": "otel-collector:4317",
"trace_type": "genai_extension",
"protocol": "grpc",
"metrics_enabled": true,
"metrics_endpoint": "otel-collector:4317",
"metrics_push_interval": 15
}
}
]
}
```
```json theme={null}
{
"plugins": [
{
"enabled": true,
"name": "otel",
"config": {
"profiles": [
{
"service_name": "bifrost",
"enabled": true,
"collector_url": "otel-collector:4317",
"trace_type": "genai_extension",
"protocol": "grpc",
"metrics_enabled": true,
"metrics_endpoint": "otel-collector:4317",
"metrics_push_interval": 15
}
]
}
}
]
}
```
### Pushed Metrics
These are the same **Prometheus-style metrics** from the telemetry plugin, pushed via OTLP protocol to a central collector:
| Metric | Type | Description |
| -------------------------------------------- | --------- | -------------------------------------- |
| `bifrost_upstream_requests_total` | Counter | Total requests to upstream providers |
| `bifrost_success_requests_total` | Counter | Successful upstream requests |
| `bifrost_error_requests_total` | Counter | Error requests with status code labels |
| `bifrost_input_tokens_total` | Counter | Total input tokens |
| `bifrost_output_tokens_total` | Counter | Total output tokens |
| `bifrost_cache_hits_total` | Counter | Cache hits |
| `bifrost_cost_total` | Counter | Total cost in USD |
| `bifrost_upstream_latency_seconds` | Histogram | Upstream request latency |
| `bifrost_stream_first_token_latency_seconds` | Histogram | Time to first token |
| `bifrost_stream_inter_token_latency_seconds` | Histogram | Inter-token latency |
| `http_requests_total` | Counter | Total HTTP requests |
| `http_request_duration_seconds` | Histogram | HTTP request duration |
| `http_request_size_bytes` | Histogram | HTTP request body size |
| `http_response_size_bytes` | Histogram | HTTP response body size |
> **Note:** Size metrics are only recorded when the `Content-Length` header is present. Requests or responses without it (e.g., chunked transfer encoding, streaming responses) do not produce data points in these histograms.
### OTEL Collector Configuration
Configure your OTEL Collector to receive OTLP metrics and export to your preferred backend (Datadog, Prometheus, etc.):
```yaml theme={null}
receivers:
otlp:
protocols:
grpc:
endpoint: 0.0.0.0:4317
http:
endpoint: 0.0.0.0:4318
processors:
batch:
timeout: 10s
send_batch_size: 1000
exporters:
# For Datadog
datadog:
api:
key: ${DD_API_KEY}
# Or for Prometheus remote write
prometheusremotewrite:
endpoint: "http://prometheus:9090/api/v1/write"
service:
pipelines:
metrics:
receivers: [otlp]
processors: [batch]
exporters: [datadog] # or prometheusremotewrite
```
### Why Push vs Pull?
| Aspect | Pull (`/metrics` scrape) | Push (OTEL metrics) |
| --------------------- | ------------------------ | -------------------- |
| Load balancer | May miss nodes | All nodes push |
| Service discovery | Required | Not required |
| Scraper configuration | Per-node endpoints | Single collector |
| Cluster aggregation | Query-side `sum()` | Collector handles it |
For **single-node deployments**, pull-based `/metrics` scraping works well. For **multi-node clusters**, push-based metrics ensures all nodes are captured.
***
## Advanced Features
### Automatic Span Management
* Spans are tracked with a **20-minute TTL** using an efficient sync.Map implementation
* Automatic cleanup prevents memory leaks for long-running processes
* Handles streaming requests with accumulator for chunked responses
### Async Emission
All span emissions happen asynchronously in background goroutines:
```go theme={null}
// Zero impact on request latency
go func() {
p.client.Emit(ctx, spans)
}()
```
### Streaming Support
The plugin accumulates streaming chunks and emits a single complete span when the stream finishes, providing accurate token counts and costs.
### Environment Variable Security
Sensitive URLs and credentials never need to appear in stored configuration. The `collector_url`, `metrics_endpoint`, and header values all accept the `env.VAR_NAME` format:
```json theme={null}
{
"collector_url": "env.OTEL_COLLECTOR_URL",
"metrics_endpoint": "env.OTEL_METRICS_ENDPOINT",
"headers": {
"Authorization": "env.OTEL_API_KEY"
}
}
```
The plugin resolves each `env.VAR_NAME` reference from the process environment at runtime. Stored configuration (database or config file) retains the `env.VAR_NAME` string — the resolved value is never persisted. API responses return `EnvVar` objects with sensitive resolved values redacted.
### Filtering Plugin Spans
By default every plugin's pre- and post-hook execution generates a span, which can bloat traces when many plugins are active (e.g. 8 built-in plugins × 2 hooks = 16 plugin spans per request). Use `plugin_span_filter` inside the OTEL plugin config to control which plugin spans are exported.
**Via config.json** (inside the OTEL plugin config):
```json theme={null}
{
"plugins": [
{
"name": "otel",
"enabled": true,
"config": {
"collector_url": "...",
"trace_type": "genai_extension",
"protocol": "http",
"plugin_span_filter": {
"mode": "exclude",
"plugins": ["logging", "compat", "telemetry", "otel"]
}
}
}
]
}
```
**Via the UI**: Open the **Observability** page, select the **Open Telemetry** connector, and click **Configure Plugin Tracing**. Toggle individual plugins on or off and save. UI-saved settings persist across restarts unless `plugin_span_filter` is set in config.json with a higher `version` value.
**Filter modes:**
| Mode | Behaviour |
| --------- | ---------------------------------------------------- |
| `exclude` | Export spans for all plugins **except** those listed |
| `include` | Export spans **only** for the listed plugins |
**Plugin names:** list each plugin using the exact name shown for it in the **Configure Plugin Tracing** sheet — this is the same name that appears in the span (`plugin..`), and it is what the filter matches against. The built-in OSS plugins are `telemetry`, `prompts`, `logging`, `governance`, `otel`, `semantic_cache`, `compat`, and `maxim`. In enterprise deployments some plugins are registered under a different name than their config key — for example the prompts and governance plugins appear as `enterprise-prompts` and `enterprise-governance` — so always copy the name from the tracing sheet rather than assuming the config key.
When a plugin span is filtered out, its children are automatically re-parented to the nearest exported ancestor so the trace hierarchy stays connected.
`plugin_span_filter` follows the standard plugin config precedence rules. To make a config.json value override UI-saved DB settings on restart, set a higher `version` on the OTEL plugin entry (e.g. `"version": 2`). See [Plugin Versioning](/deployment-guides/config-json/plugins) for details.
***
## When to Use
### OTel Plugin
Choose the OTel plugin when you:
* Have existing OpenTelemetry infrastructure
* Need to correlate LLM traces with application traces
* Require compliance with enterprise observability standards
* Want vendor flexibility (switch backends without code changes)
* Need multi-service distributed tracing
### vs. Built-in Observability
Use [Built-in Observability](./default) for:
* Local development and testing
* Simple self-hosted deployments
* No external dependencies
* Direct database access to logs
### vs. Maxim Plugin
Use the [Maxim Plugin](./maxim) for:
* Advanced LLM evaluation and testing
* Prompt engineering and experimentation
* Team collaboration and governance
* Production monitoring with alerts
* Dataset management and curation
***
## Troubleshooting
### Connection Issues
Verify collector is reachable:
```bash theme={null}
# Test HTTP endpoint
curl -v http://localhost:4318/v1/traces
# Test gRPC endpoint (requires grpcurl)
grpcurl -plaintext localhost:4317 list
```
### Missing Traces
Check Bifrost logs for emission errors:
```bash theme={null}
# Enable debug logging
bifrost-http --log-level debug
```
### Authentication Failures
Verify environment variables are set:
```bash theme={null}
echo $OTEL_API_KEY
```
***
## Next Steps
* **[Built-in Observability](./default)** - Local logging for development
* **[Maxim Plugin](./maxim)** - Advanced LLM evaluation and monitoring
* **[Telemetry](../telemetry)** - Prometheus metrics and dashboards